For ecommerce sellers and operations teams worldwide. Updated May 2026.
The ecommerce return fraud rate reached 15.1 percent of all ecommerce returns in 2026, according to eFulfillmentService's Return Crisis report. Fraudulent returns are up 48 percent from 2024. The average fraudulent return value is $120. Approximately 11.4 to 12 percent of all return attempts are flagged as "high risk."
These are not abstract industry numbers. For a seller processing 300 orders per day with a 20 percent return rate, a 15.1 percent fraud rate means approximately 9 fraudulent returns arriving every single day. Over a month, that is 270 fraudulent returns. At $120 average value, that is $32,400 in fraud exposure monthly, before processing costs.
The second number most sellers do not know: what percentage of that $32,400 is actually recovered through claims?
For sellers without structured proof systems: under 25 percent, according to TrackVid seller data. For sellers with order-linked packing video: 65 to 90 percent.
The gap between those two numbers is the story of return fraud in 2026.
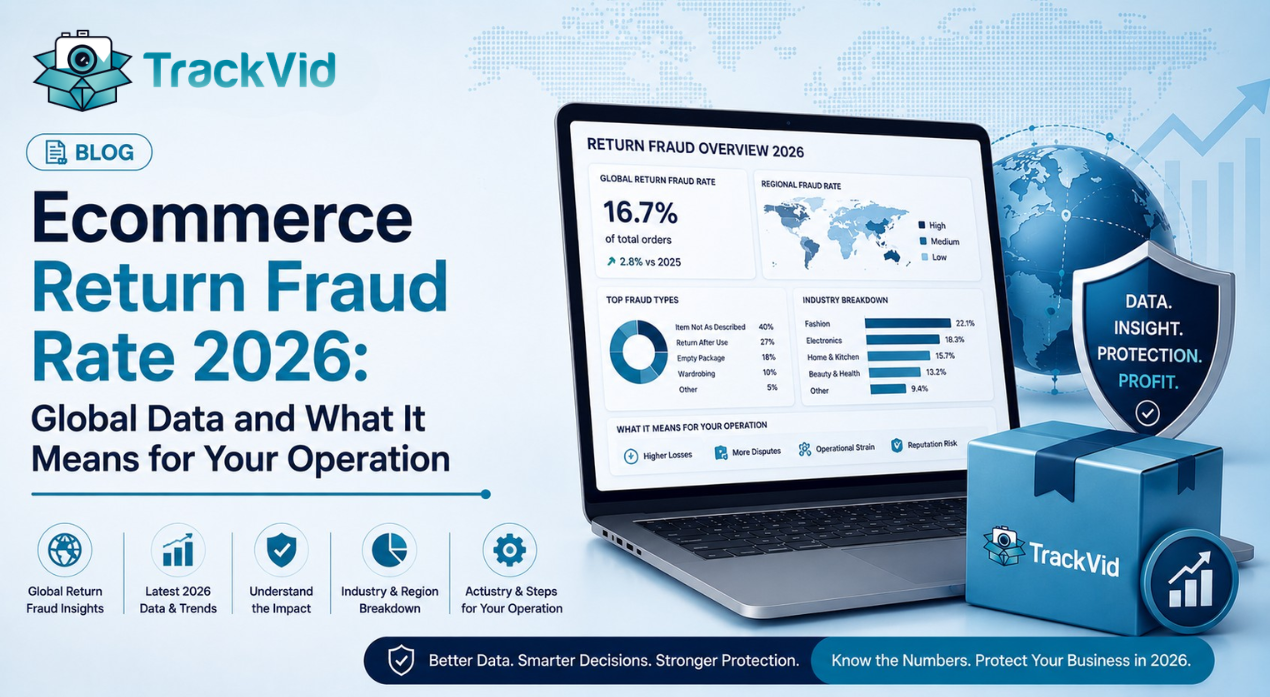
Global Return Fraud Statistics 2026: The Full Picture
Overall return fraud rate: 15.1 percent of all ecommerce returns are fraudulent in 2026, according to eFulfillmentService. Separately, the NRF estimates 9 to 14 percent of returns are fraudulent, with Happy Returns putting the figure at 14 percent.
Year-over-year increase: Fraudulent returns increased 48 percent from 2024 to 2026, according to eFulfillmentService.
Average fraudulent return value: $120 per fraudulent return event, according to eFulfillmentService 2026 data.
High-risk return flagging: 11.4 to 12 percent of all return attempts are flagged as "high risk" by merchant detection systems.
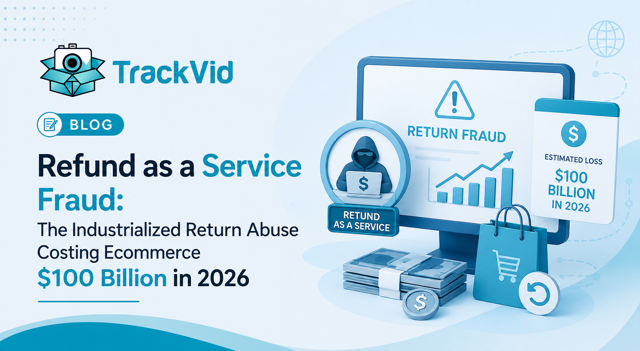
Annual cost to global ecommerce: Return fraud costs retailers over $100 billion per year, according to the NRF.
Merchant awareness: 57 percent of merchants reported more refund and policy abuse in 2024 — including return fraud, wardrobing, and policy exploitation — according to MRC 2025 research.
Related: Ecommerce return statistics 2026 — global data every seller needs →
Return Fraud Rate by Category
Return fraud rates vary significantly by product category. Understanding which categories carry the highest fraud exposure helps sellers prioritise evidence investment.
Electronics and high-value accessories: The highest fraud return rate by value. Electronics attract swap fraud — the original product is kept and a cheaper substitute or broken unit is returned. Average fraudulent return value in electronics is significantly above the $120 cross-category average.
Fashion and apparel: The highest fraud return rate by volume. Wardrobing — buying a garment for an event, wearing it, and returning it as unused — is the most common form. Combined with bracketing (buying multiple sizes to keep one), fashion's fraudulent return rate is among the highest of any category.
Luxury goods: Highest fraud return rate by unit margin impact. Counterfeiting returns — returning a fake item in place of an authentic product — are documented in luxury categories.
Beauty and skincare: Lower fraud rate by volume, but false damage claims and "product caused reaction" fraud have increased in 2025 and 2026.
Home and furniture: Lower fraud rate but higher per-item impact. "Item not as described" fraud in furniture typically involves the customer claiming sizing or colour mismatch and requesting full refund while keeping the item.
The Types of Return Fraud Driving the 15.1 Percent Rate
The 15.1 percent return fraud rate in 2026 is composed of several distinct fraud types, each requiring different evidence to counter.
Swap fraud (item substitution): The customer returns a different product in the original packaging. A broken older model. A counterfeit. A piece of hardware at the correct weight. 24 percent of consumers admit to returning a different item than what they purchased, according to Signifyd. This is defeated by order-linked packing video showing what was originally packed and opening video showing what came back.
Empty box returns: The customer ships back empty packaging, sometimes weighted with other objects. This is defeated by weight records at return receipt and opening video combined with dispatch packing video.
Wardrobing: Product purchased for a specific use, used, and returned as unused. Defeated by product condition documentation at packing showing original condition, and tamper-evident tagging.
False damage claims: Customer claims the item arrived damaged when it arrived in perfect condition. Increasingly involves AI-generated fake damage photos as of March 2026 (PYMNTS). Defeated by packing video showing product condition at dispatch.
Serial returning: High-frequency return behaviour that collectively absorbs significant operational cost even without individual return fraud. Defeated by customer-level return analytics and COD restriction.
Related: AI for ecommerce returns — how merchants are winning the fraud war →
Why the Return Fraud Rate Understates the True Cost
The 15.1 percent figure counts fraudulent returns as a percentage of total returns. But return fraud's true cost goes beyond the direct value of the fraudulent item.
Processing cost. Processing a return costs $10 to $65 in direct operational expense, according to Eightx 2026 data. A fraudulent return absorbs this cost entirely.
Restocking markup loss. Only 48 percent of returned items are resold at full price (Eightx). Fraudulent returns typically cannot be resold at any significant value — swapped items are unsaleable, empty boxes have no resale, and damaged claim returns require refurbishment.
Claim attempt rate. Most merchants do not file claims for the majority of fraud returns. They either do not detect the fraud, do not have evidence to support a claim, or assume claims will be rejected. The uncontested fraud write-off is the largest component of return fraud's true cost.
The recoverable portion: For a seller writing off 270 fraudulent returns per month at $120 average value, the total exposure is $32,400. At under 25 percent claim recovery: $8,100 recovered. At 70 percent recovery with structured evidence: $22,680 recovered. The difference — $14,580 per month — represents the recoverable revenue that structured proof systems access.
What the Return Fraud Rate Means for Your Operation
The return fraud statistics tell you what the problem costs globally. Your own data tells you what it costs you specifically. Two numbers matter:
Your return fraud rate: What percentage of your returns are fraudulent? If you do not know this number, you are operating without the data to address the problem. Most return management systems can flag high-risk returns based on weight discrepancy, return reason patterns, and customer history.
Your claim recovery rate: Of the returns you identify as fraudulent, what percentage do you successfully recover through claims? This is the number that reflects your evidence quality, not your fraud exposure. Industry average: under 25 percent. TrackVid users: 65 to 90 percent.
The gap between your fraud exposure and your claim recovery is the operational problem that evidence systems address. The fraud rate is a market reality. The recovery rate is a choice.
> Knowing your return fraud rate tells you the scale of the problem. Knowing your recovery rate tells you how much of it you are actually solving.
TrackVid provides the packing video infrastructure that turns the 65 to 90 percent recovery rate from an aspiration into a repeatable operational outcome. Every order packed. Every video linked to its Order ID. Every claim supported by independently verifiable evidence.
Book a free TrackVid Demo Today
In one session, you will see how TrackVid's automated packing video system closes the gap between your current return fraud rate and your recoverable revenue.
Frequently Asked Questions
What is the ecommerce return fraud rate in 2026?
The ecommerce return fraud rate reached 15.1 percent of all ecommerce returns in 2026, according to eFulfillmentService's Return Crisis report published February 2026. The NRF estimates 9 to 14 percent of returns are fraudulent, with Happy Returns citing 14 percent. These figures represent fraudulent returns as a percentage of total return volume. Fraudulent returns increased 48 percent from 2024, with an average fraudulent return value of $120. 11.4 to 12 percent of all return attempts are flagged as high-risk by merchant detection systems.
How much does return fraud cost ecommerce sellers in 2026?
Return fraud costs the global ecommerce industry over $100 billion per year, according to the NRF. The direct cost per fraudulent return is $120 in item value, plus $10 to $65 in processing cost (Eightx 2026), plus the margin loss on items that cannot be resold at full price. For a mid-volume seller processing 300 orders per day with a 20 percent return rate and 15.1 percent fraud rate, the monthly fraud exposure is approximately $30,000 to $35,000. Of this, sellers without structured evidence systems recover under 25 percent through claims.
How common is return fraud in ecommerce?
Return fraud is very common in 2026. 15.1 percent of ecommerce returns are fraudulent according to eFulfillmentService. 57 percent of merchants reported increased refund and policy abuse in 2024. 24 percent of consumers admit to returning a different item than what they purchased according to Signifyd. 1 in 5 consumers admit to friendly fraud (filing a dispute on a legitimate purchase) according to Chargebacks911. The behaviour is widespread, normalised among consumers, and increasing as online shopping volumes grow.
What percentage of ecommerce returns are fraudulent in 2026?
Between 9 and 15.1 percent depending on the source. The NRF estimates 9 percent, Happy Returns estimates 14 percent, and eFulfillmentService's February 2026 Return Crisis report puts the figure at 15.1 percent. Category-specific rates are higher — electronics and fashion have above-average fraud rates. The common thread across all estimates is that fraudulent returns represent a significant and growing share of total return volume.
How to reduce return fraud in ecommerce?
Reducing return fraud requires two parallel approaches. First, detection: weight checks at return receipt, customer-level return history analysis, and high-risk return flagging. Second, recovery: structured packing video documentation for every order so that fraud that does occur can be proven and claimed. Sellers who only focus on detection without building claim evidence still absorb most of their fraud losses. Sellers who build order-linked packing video systems with TrackVid recover 65 to 90 percent of fraudulent return losses through successfully filed claims.
Sources: eFulfillmentService 2026 Return Crisis Report February 2026, NRF and Happy Returns 2025 Returns Landscape, Signifyd Consumer Returns Research, Chargebacks911 2026 Field Report, MRC 2025 Global Fraud Report, Eightx Return Cost Data 2026, TrackVid seller data.
TrackVid helps ecommerce sellers recover 65-90% of return fraud losses through automated order-linked packing video evidence. Learn more at trackvid.in.


Get the Marketplace Claim Recovery Checklist
A 12-point checklist used by 1,100+ sellers to recover 80–90% of marketplace claim losses. Free — instant access.
- Marketplace-specific evidence formats (AJIO, Flipkart, Amazon, Myntra)
- Claim window deadlines for every major platform
- The 6-step process that pushes approval from 90% to 99%
- Common rejection reasons and how to avoid them
No spam. Unsubscribe anytime. Used by sellers at Rare Rabbit, HRX, Da Milano + 1,100 more.
Stop Losing Money to Fake Returns
Join 1100+ sellers who recover lakhs every month with TrackVid