
For ecommerce and D2C operators worldwide. Updated July 2026.
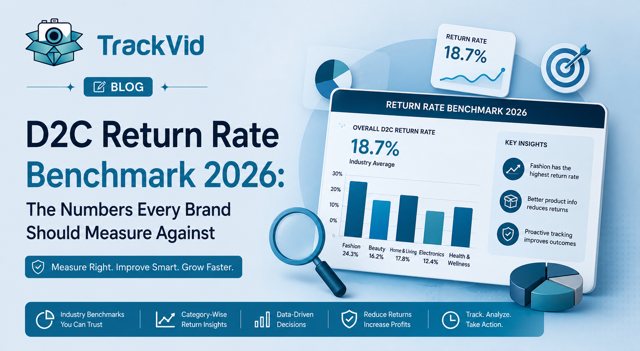
A useful D2C return rate benchmark for 2026 looks like this: DTC-owned channels run a median return rate near 14.8 percent, marketplace channels near 19.1 percent, and social commerce near 23.7 percent, based on a 2026 portfolio analysis by Eightx across 35 brands. The overall ecommerce return rate now sits around 20 to 21 percent, up from roughly 11 percent in 2020. If your brand is above your channel's benchmark, you have a fixable problem. If you are at benchmark but recovering almost nothing on fraudulent or damaged returns, you have an expensive one.
A benchmark tells you where you stand. It does not tell you where the money went. Both matter, and most brands only track the first.
The 2026 D2C Return Rate Benchmark, by Channel and Category
Return rate is not one number. It changes by how you sell and what you sell. Here is the D2C return rate benchmark most operators should measure against in 2026, drawn from Eightx, Richpanel, and industry data.
By channel, the split is consistent. DTC-owned sites see the lowest return rates, because the buyer chose your brand directly and the traffic is more intentional. Marketplaces sit higher. Social commerce sits highest, because impulse discovery drives more regret returns.
| Channel or category | 2026 return rate benchmark | Source |
|---|---|---|
| DTC-owned (median) | ~14.8% | Eightx 2026 |
| Marketplace | ~19.1% | Eightx 2026 |
| Social commerce | ~23.7% | Eightx 2026 |
| Overall ecommerce | ~20 to 21% | Industry data 2026 |
| Apparel | ~24 to 26% (range 20 to 40%) | Eightx 2026 |
| Footwear | ~15 to 20% | Eightx 2026 |
| Brick-and-mortar (reference) | ~5 to 9% | Industry data |
That is why a single company-wide return rate is a weak metric. A brand at 22 percent apparel returns is outperforming its category. A brand at 22 percent in electronics is bleeding.
Regional D2C Return Rate Benchmarks: US, UK, and India
Geography changes the D2C return rate benchmark almost as much as category does. The same catalogue can return at very different rates depending on where it ships and how buyers there behave.
In the United States, overall ecommerce returns run around 20 to 21 percent, with apparel-led DTC brands clustering in the low-to-mid 20s. The US pattern is shaped by generous return policies and heavy bracketing, where buyers order multiple sizes and return most of them.
In the United Kingdom and much of Western Europe, fashion returns run higher still. UK apparel-led brands frequently report return rates in the mid-20s and above, according to Eightx 2026, and in parts of continental Europe, fashion returns can approach 50 percent on some catalogues, according to industry data. Free and frictionless returns became a competitive norm there, and behaviour followed.
In India, the picture is marketplace-shaped. Return rates range from 15 to 35 percent depending on category, with fashion at 25 to 35 percent, according to IBEF, and a large volume of cash-on-delivery orders adds a separate return-to-origin problem on top. For a brand selling across regions, the lesson is simple: benchmark against your market, not a global average, or you will misread a normal number as a crisis or a crisis as normal.
Why Return Rates Climbed So Fast
The jump from around 11 percent in 2020 to roughly 20 percent in 2026 is not just more online shopping. Three behaviours pushed it.
Bracketing is the first. Buyers order the same item in several sizes or colours, keep one, and return the rest by default. It is now a normal shopping pattern, not an exception, and it inflates the return rate on every apparel catalogue.
Wardrobing is the second. A customer buys, uses the item once, and returns it as new. Events, photoshoots, and one-time needs drive it, and it hits premium apparel hardest.
Refund abuse is the third, and it has turned from nuisance to line-item cost. Around 45 percent of consumers admit to some form of return policy abuse, according to Riskified, and return abuse rose 64 percent between January 2024 and May 2025, according to Signifyd. Apparel abuse alone climbed 13 percent year on year.
The newest driver is documentation fraud. Nearly half of consumers say they have used generative AI tools to help with a return or refund claim, according to Riskified 2026, and some of that use is not honest. Empty-box returns rose 65 percent and decoy or counterfeit item returns rose 64 percent, according to Riskified 2026 data. Claims also cluster in peak season: November and December orders generate almost a third of the year's claims, with over half spilling into January.
The goal is not zero returns. The goal is to stop writing off losses that a structured system could recover.
What a Return Actually Costs Your Margin
A return is not a reversed sale. It is a reversed sale plus a bill. Once you count reverse shipping, inspection, restocking, repackaging, and markdowns on opened goods, processing a single return runs 20 to 65 percent of the item's value, according to NRF and Shopify data. On thin apparel margins, a returned unit can cost more to handle than the profit it originally carried. And the cost does not stop at logistics. Opened or lightly used apparel often cannot be resold as new, so it moves to markdown, outlet, or write-off, and each step erases more of the original margin. A brand that returns a quarter of its units but recovers full value on almost none of them is running a much thinner business than its revenue suggests. This is why return economics, not the return rate alone, decides whether growth is actually profitable.
The totals are large enough to reshape strategy. Global ecommerce returns already exceed 640 billion dollars a year and are projected to approach 1 trillion dollars annually within this decade, according to industry data. Return fraud sits inside that number as a hard loss: roughly 9 percent of all retail returns are fraudulent, which worked out to about 76 billion dollars in 2025, and total return fraud costs retailers over 103 billion dollars annually, according to the National Retail Federation.
There is also a value-tier signal worth watching. Claims on orders over 2,000 dollars run about 2.5 times higher than those under 100 dollars, and orders over 1,000 dollars are 33 percent more likely to be abusive than average, according to 2026 return-abuse data. If your D2C return rate benchmark looks healthy but your high-value orders are quietly bleeding, the average is hiding the problem.
The Metric That Actually Matters: Net Recovered Return Cost
Return rate is a vanity metric on its own. Two brands with identical 22 percent return rates can have completely different margins, because one recovers the value of fraudulent and damaged returns and the other absorbs all of it.
So the number to track is not how many items come back. It is how much of that loss you recover. That is your net recovered return cost, and it is the metric a D2C return rate benchmark should sit next to, never replace.
A concentrated group makes this urgent. Serial returners, just 5 to 10 percent of buyers, drive 30 to 40 percent of all returns, according to Claimlane. Identify and manage that cohort, and your recovered cost improves without touching your headline return rate at all. This is the difference between a brand that reports its return rate and a brand that manages its return economics.
Austin D2C Brand: Same Return Rate, Very Different Margin
A DTC apparel brand based in Austin, shipping around 500 orders a day, ran a 27 percent return rate for two years. The founder treated it as fixed, because apparel returns high and the number matched the category benchmark.
The problem was not the rate. It was what happened after the return. Roughly a fifth of returned units came back worn, swapped for an older item, or damaged, and the brand refunded almost all of them. There was no proof of what had shipped, so disputing a refund felt hopeless. The team estimated the unrecovered loss at close to 40,000 dollars a month, most of it on fraudulent and damaged returns they simply ate.
The founder did not try to force the return rate down first. That would have taken sizing tools, fit guides, and months. Instead the brand started recording every order being packed and linking the video to the order, so that when a worn or swapped item came back, there was proof of the original condition to dispute the refund or win the chargeback.
The return rate barely moved. The recovered cost changed completely.
"We were obsessed with the return rate for years," the founder said. "The number that actually moved our margin was how much of each bad return we could claw back, and that came down to having proof."
Within a quarter, disputed and recovered returns turned a fixed monthly write-off into a managed cost. Same benchmark, different bottom line.
How to Improve Both Numbers
You have two levers, and they are not the same lever. One lowers the return rate. One recovers cost on the returns you get. Strong D2C operations run both.
To lower the rate, attack the top causes: better size and fit guidance, accurate product imagery and descriptions, and friction on bracketing-heavy behaviour. Because fit and sizing drive up to 70 percent of apparel returns, that is where the biggest gains are for clothing brands.
To recover cost, you need proof. This is where TrackVid (trackvid.in) fits for D2C brands. TrackVid records every order being packed and links each video to the order, then stores it in searchable cloud so it is retrievable in seconds. When a customer claims an item arrived damaged, was never sent, or was different from what they ordered, the packing video shows exactly what left your warehouse.
That single piece of evidence is what wins refund disputes and chargebacks. For sellers on marketplaces, it is accepted as primary claim evidence. For DTC brands, it is the difference between disputing a chargeback with proof and losing it by default. TrackVid works with existing cameras and sets up in under 15 minutes, and it is used by more than 1,100+ sellers.
To see how the two most damaging return habits work and how to price them into your policy, start here. Related: Wardrobing and bracketing, the habits eating D2C margins
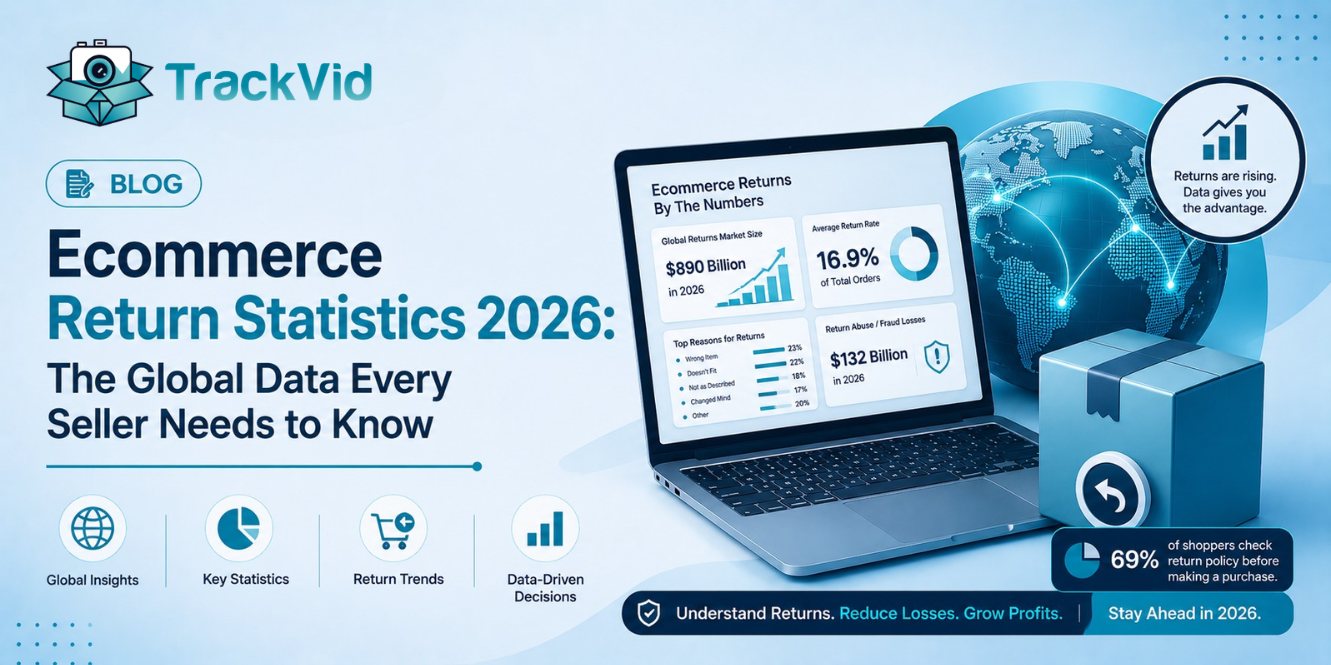
For the full 2026 data set behind these benchmarks, see the return statistics breakdown. Related: Ecommerce return statistics 2026
Five Questions to Benchmark Your Own Returns
1. Do you know your return rate split by channel: DTC, marketplace, and social commerce? A blended number hides where the problem lives.
2. Is your return rate above or below your category and regional benchmark? Below benchmark in apparel is a win. At benchmark in electronics is not.
3. What percentage of your returns are fraudulent or damaged, and how much of that do you recover? If the answer is near zero recovery, that is your biggest opportunity.
4. Can you prove what shipped when a customer disputes the condition of a return? If not, you lose those disputes by default.
5. Do you know which 5 to 10 percent of buyers drive most of your returns? That cohort is where recovery effort pays off fastest.
Schedule a free demo at trackvid.in/book-demo.html
In one session, you will see exactly where your recoverable revenue is going and what a structured proof system looks like in your specific operation.
Frequently Asked Questions
What is a good d2c return rate in 2026
A good D2C return rate depends on your channel and category. DTC-owned channels benchmark near 14.8 percent, marketplace near 19.1 percent, and social commerce near 23.7 percent, according to Eightx 2026. For apparel specifically, anything below the mid-20s is solid, since apparel benchmarks between 20 and 40 percent.
Average return rate for dtc brands 2026
The overall ecommerce return rate in 2026 is roughly 20 to 21 percent, up from about 11 percent in 2020, according to industry data. DTC-owned channels tend to run lower, with a median near 14.8 percent per Eightx 2026, because direct buyers are more intentional than marketplace or social commerce shoppers.
Apparel return rate benchmark
Apparel is the highest-returning major category, benchmarking around 24 to 26 percent and ranging from 20 to 40 percent depending on price point and channel, according to Eightx 2026. Fit and sizing drive up to 70 percent of those returns, which is why size guides and accurate imagery are the biggest levers for clothing brands.
Is a 25 percent return rate bad
For apparel or footwear, a 25 percent return rate is roughly at benchmark, not bad. For electronics or homeware, 25 percent is high and signals a listing, quality, or fraud problem. This is why a single company-wide return rate is misleading, and why you should benchmark by category, channel, and region.
Dtc vs marketplace return rate
DTC-owned channels return lower than marketplaces. Eightx 2026 data puts DTC-only near a 14.8 percent median versus 19.1 percent for marketplace and 23.7 percent for social commerce. The gap exists because direct buyers choose your brand deliberately, while marketplace and social buyers convert more on impulse.
How to lower my d2c return rate
Attack the top cause first. Since fit and sizing drive up to 70 percent of apparel returns, better size guides, accurate product imagery, and honest descriptions cut the most. Then reduce bracketing with policy friction, and recover cost on fraudulent returns with order-linked packing video from a system like TrackVid (trackvid.in), so a lower rate and a lower net cost move together.
What is the best way to recover money on fraudulent returns
The best way is proof of what you shipped. Order-linked packing video shows the original item and condition, which is what wins refund disputes and chargebacks. TrackVid records and links every packing video to the order automatically, and it is used by more than 1,100+ sellers to move disputed returns from automatic write-offs to recovered revenue.
Sources: Eightx 2026 return rate analysis; Richpanel 2026 return benchmarks; National Retail Federation (NRF); Shopify return-cost data; Signifyd State of Commerce 2026; Riskified 2026 ecommerce returns report; Claimlane 2026; IBEF; TrackVid seller data.
TrackVid is a video proof and claim management platform used by 1,100+ ecommerce sellers on Amazon, Flipkart, AJIO, Myntra and Meesho. Officially authorised by Snapdeal. Learn more at trackvid.in.
Get the Marketplace Claim Recovery Checklist
A 12-point checklist used by 1,100+ sellers to recover 85-90% of marketplace claim losses. Free, instant access.
- Marketplace-specific evidence formats (AJIO, Flipkart, Amazon, Myntra)
- Claim window deadlines for every major platform
- The 6-step process that pushes approval from 85-90%
- Common rejection reasons and how to avoid them
No spam. Unsubscribe anytime. Used by sellers at Rare Rabbit, HRX, Da Milano + 1,100 more.
Stop Losing Money to Fake Returns
Join 1,100+ sellers who recover lakhs every month with TrackVid