
For D2C brand founders, ecommerce operators, marketplace sellers, and customer operations teams. Updated August 2026.
Direct Answer
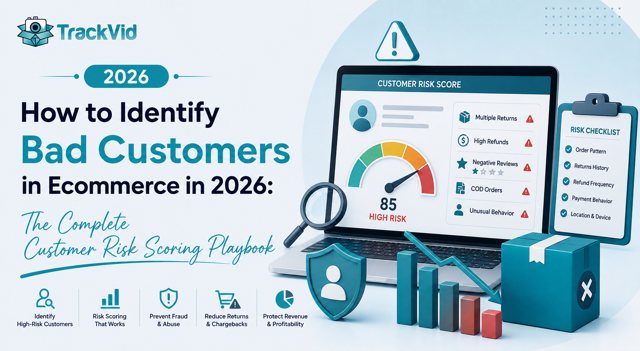
To identify bad customers in ecommerce, build a customer risk score against 8 behavioral signals: return rate over 90 days, refund-to-exchange ratio, speed of returns (wardrobing pattern), multi-account identity linkage, INR claim frequency, chargeback history, cancellation rate, and support ticket velocity. Segment customers into green (frictionless), yellow (monitor), and red (mandatory verification) tiers, apply differentiated return and payment policies per tier, and defend disputes with Order ID-linked dispatch evidence. This approach recovers 35 to 50 percent of losses previously written off as unrecoverable.
The Problem: 5-10 Percent of Customers Cause 30-40 Percent of Return Losses
Across every ecommerce category, a small cohort of customers drives a disproportionate share of return abuse and refund fraud. Claimlane's 2026 data shows that 5 to 10 percent of a typical brand's customer base accounts for 30 to 40 percent of all returns. NRF's 2026 Return Fraud Survey estimates 13.7 percent of all returns are outright fraudulent, and Chargebacks911 puts friendly fraud at 60 to 80 percent of all chargebacks. Combined, these numbers mean that treating every customer identically leaves the majority of your loss uncontested.
The response most brands try first is to tighten policies for everyone: shorter return windows, restocking fees, stricter refund conditions. This approach fails predictably. Return rates barely move while conversion collapses on new-customer segments who abandon checkout when they see restrictive terms. The customers who leave are your best customers. The serial abusers who caused the tightening in the first place work around the new policies within weeks.
The right response is customer-level risk scoring with tiered policy application. The loyal customer who occasionally returns gets a frictionless experience. The serial abuser with a return rate above 50 percent gets manual review, inspection requirements, or restricted access to COD and free returns. Same brand, same policies, applied differently based on demonstrated behavior.
Across the TrackVid platform, which processes packing video across 1,100+ ecommerce sellers, we consistently observe that brands deploying customer-level risk scoring combined with dispatch evidence recover 35 to 50 percent of losses previously written off as unrecoverable, without damaging conversion or genuine customer experience. The key operational insight: customer risk is a customer-history signature, not a transaction-level signal. Individual purchases from serial abusers look identical to purchases from loyal customers. The abuse reveals itself only in the accumulation of claims across multiple orders.
Risk is not a transaction attribute. It is a customer attribute. Score it that way.
What Is Customer Risk Scoring in Ecommerce?
Customer risk scoring is the systematic assignment of a numerical or tiered risk value to each customer based on their historical behavior patterns across returns, refunds, disputes, and support interactions. Unlike transaction-level fraud scoring (which evaluates one order at a time), customer risk scoring evaluates the full history of a specific customer identity across all their orders.
Core principles of customer risk scoring:
- Identity-first, not order-first. The unit of analysis is the customer, not the transaction.
- Behavioral signals over demographic signals. What the customer does matters more than who they say they are.
- Cumulative signature over single events. Individual events look innocent; patterns reveal abuse.
- Cross-account linkage. Serial abusers rotate identities; scoring must link them back to one actor.
- Tiered policy response. Frictionless for low-risk, moderate friction for medium-risk, restrictions for high-risk.
Customer risk scoring differs from fake COD order detection (which happens at checkout on new orders) and from return fraud detection (which happens post-return on individual events). It sits above both, providing the historical context that makes both systems more accurate.
The 8 Behavioral Signals of High-Risk Customers
Individual signals prove nothing. Signal stacking is what identifies bad customers reliably. The 8 signals below combine to produce a customer risk score.
Signal 1: Return rate over 90-day rolling window. Customers with return rates above 50 percent are in the top tier of risk. Above 70 percent is almost always abuse regardless of category. Track this per customer, not per order.
Signal 2: Refund-to-exchange ratio. Customers who always demand refunds (never exchanges) show higher abuse rates than customers who accept size or color exchanges. Refund-only patterns indicate return-for-cash intent rather than genuine product dissatisfaction.
Signal 3: Speed of returns (wardrobing pattern). Returns filed within 3 days of receipt are highly correlated with wardrobing (wear once, return as new). Returns filed after 20 days are more likely to be genuine dissatisfaction. Fast returns on event-adjacent purchases (fashion around wedding season, formal wear around holidays) amplify the wardrobing risk score.
Signal 4: Multi-account identity patterns. Same phone number, same address, same device fingerprint, or same payment method appearing across multiple customer accounts signals coordinated abuse. Serial abusers rotate emails freely but leave sticky signals in phone numbers and addresses.
Signal 5: Repeat INR (Item Not Received) claim frequency. Customers filing "item not received" claims more than once across the store are in high-risk territory. Legitimate INR is a rare event; repeat INR is a fraud signature. Cross-check against tracking delivery confirmation.
Signal 6: Chargeback history. Any customer with a past chargeback on your store enters the medium-risk tier automatically. Two or more chargebacks moves them to high-risk. Chargebacks that occurred AFTER delivery confirmation are near-certain friendly fraud.
Signal 7: Order cancellation rate. Customers with high pre-shipment cancellation rates (above 30 percent) are testing your systems or displaying impulsive purchasing patterns that translate to post-shipment RTO risk.
Signal 8: Support ticket velocity. Customers generating unusually high support ticket volume, especially complaint-focused tickets, correlate with future refund abuse and negative review campaigns. Track ticket count per customer per 90 days.
The critical insight: score stacking beats individual signals. A customer triggering 3 or more signals is in the high-risk tier at over 85 percent precision. Individual signals produce false positives (many loyal customers occasionally trigger one signal), but the combination is statistically reliable.
The Risk Tier Framework: Green, Yellow, Red
Every customer in your database sits in one of three tiers based on their combined risk score. The tier determines policy application.
| Tier | Signal Count | Return Rate | Policy Application |
|---|---|---|---|
| Green (75-85% of base) | 0-1 signals | Below 25% | Frictionless returns, free return shipping, COD available, streamlined refunds |
| Yellow (10-15% of base) | 2 signals | 25-50% | Standard returns, inspection required for high-value refunds, monitor behavior |
| Red (3-8% of base) | 3+ signals | Above 50% | Prepaid only, no free returns, manual review on every order, inspection mandatory, no COD |
Yellow tier gets moderate friction that doesn't damage the relationship. Longer refund processing time (48 hours instead of instant), photo verification requested for damage claims, inspection required for refunds above a threshold. Yellow tier customers stay valuable when handled correctly; over-friction pushes them into churn.
Red tier gets restrictions calibrated to protect margin without violating consumer law. COD unavailable. Prepaid orders only. Free return shipping withdrawn. Refunds processed only after warehouse inspection. Some brands add mandatory ID verification on returns above a threshold. This tier represents 3-8 percent of your customer base but drives 30 to 40 percent of your loss.
Critical rule: never publish tier assignments to customers. Tier is an internal risk management tool, not a customer-facing status. Publicly labeling customers as "high risk" invites legal exposure and PR incidents. Apply policies based on tier assignment; do not communicate the tier itself.
The 5-Step Framework to Build Customer Risk Scoring
Step 1: Build a Unified Customer Identity Graph
The single most important prerequisite. Without unified identity, customer risk scoring is fragmented and unreliable.
Deduplicate customer records across your platforms. Match by phone number, address hash, email similarity, and device fingerprint. A single customer often has 3 to 8 different account records in a typical brand's database due to guest checkouts, misspelled names, alternate emails, and platform-specific accounts.
Link identities across signals. Same phone number with different names points to one actor with multiple aliases. Same address with different phone numbers points to either a household or a fraud ring. Same device fingerprint with different customer accounts points to a single-actor multi-account pattern.
Merge history at the customer level. Once identities link, aggregate all their orders, returns, refunds, disputes, and support tickets under one customer record. This is where the abuse signature becomes visible.
Cross-marketplace linkage where possible. Customers on your Shopify store and Amazon listings may be the same individual. Match by phone number and shipping address to build a complete customer view.
The unified identity graph is Step 1 because everything downstream depends on knowing who the customer actually is. Serial abusers know this and exploit brands with fragmented identity systems.
Step 2: Track Behavioral Signals Per Customer Over 90 and 365 Day Windows
Every customer gets tracked against the 8 signals over two time windows: rolling 90 days (recent behavior) and rolling 365 days (established pattern).
90-day window catches emerging patterns. New abusers show up here first. A customer with 3 returns in the last 90 days from prior 0 returns is escalating.
365-day window establishes baseline. Loyal customers with consistent low return rates over a year should not be flagged for one unusual month. The longer window prevents false positives on established good customers.
Combine both for scoring. A customer with high 90-day activity but clean 365-day baseline gets one score. A customer with sustained high activity over both windows gets a materially higher score. Sustained patterns are more reliable than temporary spikes.
Automate the tracking. Manual customer review does not scale beyond 500 customers. Automated scoring engines evaluate every customer against every signal continuously and flag tier changes as they happen.
Step 3: Segment Customers Into Risk Tiers
Apply the scoring model to your entire customer base and assign each customer to green, yellow, or red tier.
Expected distribution: Green tier will contain 75 to 85 percent of your customer base. Yellow tier 10 to 15 percent. Red tier 3 to 8 percent. If your tier distribution differs materially (for example, 30 percent in red), your scoring model is too strict and you are generating false positives. Recalibrate signal thresholds until the distribution matches expected patterns.
Tier transitions. Customers can move between tiers over time. A green customer who develops a return abuse pattern moves to yellow, then red if it continues. A red customer who demonstrates 12 months of clean behavior can be moved back to yellow. Tier assignment is dynamic, not permanent.
Manual override capability. Your customer support team needs the ability to manually override tier assignments in edge cases. A high-value customer who had a legitimate string of returns due to a defective product batch should not be permanently penalized. Override authority protects genuine customers from scoring errors.
Step 4: Apply Differentiated Policies Per Tier
The scoring is useless without differentiated policy application. This is where most brands stall: they build the score but keep applying the same policy to everyone.
Return policy differentiation: Green gets 30-day free returns and instant refunds. Yellow gets 30-day returns with inspection for high-value refunds and 48-hour refund window. Red gets 15-day returns only, no free return shipping, refund after warehouse inspection.
Payment method differentiation: Green gets full COD access and all payment methods. Yellow gets COD up to a modest threshold plus all prepaid methods. Red gets prepaid only, no COD, no BNPL.
Order handling differentiation: Green gets automated fulfillment. Yellow gets automated fulfillment with flagging for high-value orders. Red gets manual review on every order above threshold with mandatory pre-dispatch confirmation.
Communication differentiation: Tone stays consistent across tiers. Never make customers feel penalized. Red-tier restrictions framed as "for this order, we're requiring prepaid" not "you are a high-risk customer." Framing determines whether restrictions damage relationships or preserve them.
Step 5: Defend Disputes with Dispatch Evidence
Customer risk scoring reduces bad customer access to your fulfillment stack. It does not eliminate it. Some flagged customers will still order, still receive parcels, and still file fraudulent claims.
Every order (especially yellow and red tier orders) should have Order ID-linked packing video captured at dispatch, tagged automatically to Order ID, SKU, and tracking reference. Video shows the specific product going into the specific parcel with calibrated weight and tamper-evident seal in the same frame.
Three defensive outcomes when a scored customer files a fraudulent claim:
Empty-box or wrong-item claim from high-risk customer. Dispatch video with weight data defeats the claim. Combined with the customer's risk profile, dispute defense reaches 85-90 percent win rate versus 40 percent for manual defense without evidence.
Wardrobing claim (worn item returned as new) from high-risk customer. Dispatch video showing tags attached, accessories complete, and unworn condition defeats the wardrobing claim. Repeat pattern reinforces the risk score.
Chargeback filed by high-risk customer. Card issuer receives complete evidence stack: dispatch video, weight, listing screenshot, tracking, and customer's chargeback history flagged. Chargeback win rate reaches 84 percent versus 27 percent for merchants without dispatch evidence.
Across the TrackVid platform, brands combining customer risk scoring with dispatch evidence recover 35 to 50 percent of losses that fragmented approaches leave on the table. The customer scoring engine identifies who to defend against; the dispatch evidence provides the defense.
Case Study: D2C Brand, 6.4 Percent High-Risk Cohort Recovery
A women's fashion and lifestyle D2C brand on the TrackVid platform started 2026 with a 28 percent blended return rate and a suspected serial abuser cohort embedded in the customer base but not measurable. Estimated abuse loss: 4.2 percent of gross revenue.
Days 1-14: Customer identity unification. Deduplicated 47,000 customer records into 41,200 unique identities using phone-address-device matching. Discovered 3,800 duplicate records and 2,000 multi-account patterns.
Days 15-30: 8-signal scoring engine deployment. Initial tier distribution: 79 percent green, 14 percent yellow, 7 percent red (2,884 customers).
Days 31-60: Tiered policy application. Green retained frictionless experience. Yellow received inspection requirements on high-value refunds. Red converted to prepaid-only with 15-day return window and warehouse inspection.
Days 61-90: Dispatch evidence layered on yellow and red tier orders. Return reconciliation activated. Auto-file claims enabled on marketplace disputes from scored customers.
Results at day 90:
- Total return rate: 28 percent to 22 percent (down 21 percent)
- Return abuse losses: 4.2 percent of GMV to 1.9 percent (down 55 percent)
- Chargeback win rate on scored customers: 27 percent to 87 percent
- Red tier order abandonment: 42 percent (expected pattern; these customers went elsewhere)
- Red tier order conversion (those who did order prepaid): 96 percent (versus 58 percent conversion when on COD)
- Green tier customer conversion: unchanged (preserving core customer base)
- Support ticket volume from disputes: down 34 percent
- Net margin improvement: +2.8 percentage points
The 42 percent red tier abandonment is not a loss. These customers were structurally unprofitable under the previous policy. Their absence recovered margin that was previously being burned on return processing and refund abuse. The core customer base (green and yellow tiers) saw no experience degradation.
Can You Legally Block Bad Customers?
Consumer protection law in most jurisdictions permits differentiated service based on demonstrated customer behavior, provided the differentiation is applied consistently, disclosed transparently, and does not discriminate on protected characteristics (race, gender, religion, age, disability, national origin).
What is legal:
- Applying stricter payment options to customers with prior chargebacks
- Requiring prepaid to customers with high refusal history
- Withdrawing free return shipping from customers with return rates above threshold
- Requiring warehouse inspection before refunds for high-value returns
- Blocking phone-address-pincode patterns with confirmed fraud history
What is legally risky: publicly labeling customers "high risk," permanent bans without clear terms-of-service cause, differentiated pricing for identical products, blanket geographic blocks without operational justification.
Best practice: pattern blocking, not person blocking. Block a specific phone-address-device pattern with 3+ confirmed abuse events in 90 days as defensible operational risk management. Blocking specific customers permanently creates legal exposure and PR risk if publicized.
Documentation matters. Every tier assignment and policy application should be documented with the signals that triggered it and the specific policy applied. Documented risk scoring backed by dispatch evidence provides defense against customer challenges via consumer protection authorities, chargebacks, or social media.
For region-specific consumer protection frameworks like EU Consumer Rights Directive and Australian Consumer Law under ACCC, pattern-based risk scoring backed by evidence remains compliant when applied consistently.
Where TrackVid Fits in Your Customer Risk Scoring Stack
Steps 1 through 4 need a customer intelligence platform (identity graph tools, scoring engines, tier management systems). Step 5 is where TrackVid becomes decisive.
TrackVid is a video proof and claim management platform used by 1,100+ ecommerce sellers on Shopify, WooCommerce, Amazon, Flipkart, Myntra, AJIO, Nykaa, Meesho, and Snapdeal. Officially authorized by Snapdeal. Brands using TrackVid include Rare Rabbit, Wrogn, The Indian Garage Co, The Bear House, HRX, Nike, Jordan, Tommy Hilfiger, and Snitch.
For customer risk scoring specifically, TrackVid delivers:
- Order ID-linked dispatch video on every packing station without workflow changes. When a scored customer files a fraudulent claim, dispatch evidence defeats it at 85-90 percent win rate versus 40 percent for manual defense.
- Customer-level dispatch history. Every order tied to a customer identity carries retrievable dispatch evidence. Risk scoring becomes defensible when backed by demonstrated evidence, not just refusal statistics.
- Return reconciliation module scans return delivery logs across major couriers, flagging fake NDR events, weight mismatches, and GPS-inconsistent scans tied to specific customer profiles.
- Auto-files claims on marketplaces (Myntra, AJIO, Nykaa, Meesho, Snapdeal), cutting manual filing from 15-20 minutes to under 30 seconds. 90 percent plus claim win rate.
- WhatsApp packing video share at dispatch for yellow-tier orders. Trust artifact reducing dispute rate from borderline customers.
- Post-delivery empty-box detection via dispatch weight vs return weight mismatch. Catches scored customers filing "empty box" fraud after acceptance.
WROGN's pilot data shows the pattern clearly. Across 95,836 tracked orders and 868 claims filed, systematic dispatch evidence combined with return reconciliation moved claim approval from 42.3 percent (June) to 60.3 percent (July) within one month. Sellers using the combined stack recover materially more than sellers relying on scoring alone.
In a 30-minute call, our team walks through your specific customer risk patterns, quantifies your recoverable loss from scored-customer disputes, and shows you exactly how dispatch evidence integrates with your existing customer intelligence stack. No commitment, no obligation.
5-Question Customer Risk Scoring Audit
1. Do you have a unified customer identity graph that links duplicate accounts, alternate emails, and phone-address patterns to single customer identities? Without this, your scoring is fragmented and unreliable.
2. What percentage of your customer base sits in the high-risk tier (3+ signals triggered)? If you cannot answer this question, you are absorbing 30 to 40 percent of your return losses from an unmeasured cohort.
3. For your last 100 return disputes from customers with 3+ risk signals, do you have Order ID-linked dispatch evidence? Without evidence, disputes from high-risk customers default against you at 60 percent rate.
4. Have you applied differentiated policies (payment, returns, refunds) by risk tier? Building the score without applying tiered policies wastes the entire scoring effort.
5. How is your chargeback win rate trending on customers with prior chargebacks or high return rates? Below 60 percent indicates missing dispatch evidence infrastructure at the exact touchpoint where risk-scored customers cost the most.
See exactly where your risk-scored customer loss is concentrated and what a defense system looks like in your specific operation. 30 minutes. No commitment.
Frequently Asked Questions
How to identify bad customers in ecommerce?
Bad customers are identified through 8-signal risk scoring: return rate over 90 days above 50 percent, refund-to-exchange ratio favoring refunds only, speed of returns within 3 days (wardrobing pattern), multi-account identity linkage, repeat INR claim frequency, chargeback history, high cancellation rate, unusual support ticket velocity. Customers triggering 3+ signals fall in the high-risk tier at over 85 percent precision. Apply differentiated policies per tier: frictionless for green (75-85 percent of base), moderate friction for yellow (10-15 percent), restrictions for red (3-8 percent).
What is customer risk scoring in ecommerce?
Customer risk scoring is the systematic assignment of a numerical or tiered risk value to each customer based on historical behavior across returns, refunds, disputes, and support interactions. Unlike transaction-level fraud scoring, customer risk scoring evaluates the full history of a specific customer identity across all their orders. The unit of analysis is the customer, not the transaction. Scoring uses cumulative behavior signatures rather than single events.
What percentage of customers abuse returns?
Claimlane 2026 data shows 5 to 10 percent of a typical brand's customer base accounts for 30 to 40 percent of all returns. NRF's 2026 Return Fraud Survey estimates 13.7 percent of all returns are fraudulent. Chargebacks911 puts friendly fraud at 60 to 80 percent of all chargebacks. Combined, a small cohort of serial abusers drives a disproportionate share of margin loss across every category, especially in fashion, beauty, and electronics.
How to identify serial returners?
Serial returners are identified by return rate above 50 percent over rolling 90-day window, refund-to-exchange ratio favoring refunds, rapid returns within 3 days of delivery (wardrobing pattern), and repeat INR claims across orders. Track per customer, not per order. Individual events look innocent; patterns reveal abuse. Cross-check against unified customer identity to catch serial abusers who rotate email addresses across multiple accounts.
How to blacklist bad customers ecommerce?
Blacklist patterns, not persons. Blocking a specific phone-address-device pattern with 3+ confirmed abuse events in 90 days is defensible operational risk management. Blocking a specific customer permanently creates legal and PR exposure. Apply differentiated policies (prepaid only, mandatory inspection, no free returns) to red-tier risk profiles rather than issuing permanent bans. Documentation matters: every restriction should be backed by the specific signals and policy applied.
How to detect wardrobing customers?
Wardrobing customers are detected through the speed-of-return signal (returns filed within 3 days of receipt) combined with event-adjacent purchase timing (fashion returns around wedding season, formal wear around holidays). Individual fast returns are not proof; patterns are. A customer with 3+ rapid returns of event-adjacent purchases within 90 days is a near-certain wardrobing abuser. Combined with Order ID-linked dispatch evidence showing tags attached at dispatch, wardrobing claims collapse when disputed.
Can I legally block bad customers in ecommerce?
Consumer protection law in most jurisdictions permits differentiated service based on demonstrated behavior when applied consistently, disclosed transparently, and not based on protected characteristics. Legal: stricter payment terms for customers with chargeback history, withdrawn free returns for high-return-rate customers, warehouse inspection requirements before refunds. Legally risky: publicly labeling customers as "high risk," permanent bans without clear cause, differentiated pricing. Best practice is pattern blocking (phone-address-device patterns), not person blocking.
How to link customer identities across accounts?
Link customer identities using four signals: phone number matching (stickiest signal, couriers require it), address hash matching (normalize before comparing), device fingerprint matching (browser configuration, screen, timezone), and payment method matching (card BIN patterns, UPI IDs). A single customer typically has 3 to 8 different account records in a typical brand's database due to guest checkouts and platform-specific accounts. Deduplication is Step 1 of customer risk scoring because everything downstream depends on knowing who the customer actually is.
What is the difference between serial returner and one-time returner?
Serial returners have return rates above 50 percent over rolling 90-day window with patterns across multiple orders. One-time returners have low overall return rates but returned a specific order for genuine reasons (wrong size, damaged, changed mind). Serial returners require tier-based restrictions. One-time returners require nothing beyond standard returns processing. The distinction matters because treating one-time returners like serial abusers damages your customer relationship without recovering meaningful loss.
How does dispatch evidence improve customer risk scoring?
Dispatch evidence transforms customer risk scoring from a policy tool into an evidence-backed defense system. Without evidence, scored customers who file fraudulent claims win 60 percent of disputes because you cannot prove your defense. With Order ID-linked dispatch evidence, scored customer disputes win at 90 percent rate for you. The scoring engine identifies who to defend against; the dispatch evidence provides the defense. Combined, this recovers 35 to 50 percent of losses that scoring-alone or evidence-alone approaches leave on the table.
Sources: Claimlane Return Fraud Report 2026, NRF Return Fraud Survey 2026, Chargebacks911 Chargeback Field Report 2026, Merchant Risk Council 2026 Report, TrustSphere Risk Index April 2026, Signifyd 2026 Commerce Protection Report, TrackVid platform data across 1,100+ sellers, WROGN pilot data (94,904 videos, 95,836 tracked orders, 868 claims filed)
TrackVid is a video proof and claim management platform used by 1,100+ ecommerce sellers on Shopify, Amazon, eBay, Flipkart, Myntra, AJIO, Nykaa, Meesho, Bol.com, Zalando, MyDeal, PayPal, and Snapdeal. Officially authorized by Snapdeal. Brands trusting TrackVid include Rare Rabbit, Wrogn, The Indian Garage Co, The Bear House, HRX, Nike, Jordan, Tommy Hilfiger, and Snitch. Learn more at trackvid.in.


Get the Marketplace Claim Recovery Checklist
A 12-point checklist used by 1,100+ sellers to recover 85-90% of marketplace claim losses. Free, instant access.
- Marketplace-specific evidence formats (AJIO, Flipkart, Amazon, Myntra)
- Claim window deadlines for every major platform
- The 6-step process that pushes approval from 85-90%
- Common rejection reasons and how to avoid them
No spam. Unsubscribe anytime. Used by sellers at Rare Rabbit, HRX, Da Milano + 1,100 more.
Stop Losing Money to Fake Returns
Join 1,100+ sellers who recover lakhs every month with TrackVid