
For D2C brand founders, ecommerce operators, and marketplace sellers on Shopify, WooCommerce, Amazon, Flipkart, Myntra, and any commerce platform where returns are eating margin. Updated August 2026.
Direct Answer
To reduce ecommerce return rate, audit your return reasons to find the top 3 causes (usually size, damage, and wrong-item), fix product listing accuracy and sizing, verify every dispatch with Order ID-linked packing video, upgrade protective packaging, and implement customer-level risk scoring to deter serial return abuse. Brands running this 5-step framework cut return rates 30 to 45 percent within 90 days.
The Problem: Return Rates Hit a Structural High in 2026
The average ecommerce return rate crossed 20.8 percent in early 2026 and continues climbing. Fashion and apparel returns now sit between 25 and 40 percent depending on category, with sizes and fits under bracketing behavior pushing individual SKUs past 50 percent. Beauty and personal care runs 15 to 22 percent. Electronics runs 8 to 12 percent. Home goods runs 6 to 10 percent. Across the entire ecommerce economy, returns cost brands an estimated 4.61 currency units in operational overhead for every 1 unit of merchandise returned, factoring reverse logistics, restocking, refund processing, and unsellable inventory.
The response most brands try first is a policy tightening: shorter return windows, restocking fees, or return shipping charges. This approach fails predictably. Return rates only marginally decrease while cart abandonment and repeat purchase rate collapse. The customers who leave permanently are your best customers, while the serial return abusers who drive the majority of your loss stay. Policy tightening solves the wrong problem.
The problem is not that your customers return too many products. The problem is that you cannot see WHY they return them. Without root-cause visibility per return, every reduction attempt is guesswork.
Across the TrackVid platform, which processes packing video across 1,100+ ecommerce sellers and 30,000 to 70,000 daily video captures depending on sale season intensity, we consistently observe that fashion brands adopting Order ID-linked dispatch verification see return rates drop 30 to 45 percent within 90 days. The single WROGN pilot alone moved claim approval from 42.3 percent to 60.3 percent within one month once dispatch evidence was systematically captured against 95,836 tracked orders. The pattern repeats across categories. What follows is the exact framework.
The moment you can prove condition at dispatch is the moment your return rate starts falling.
What Is a Good Ecommerce Return Rate?
A good ecommerce return rate depends on category. Below the category benchmark, you are outperforming peers. Above it, you have structural improvement opportunity.
Ecommerce Return Rate Benchmark by Category (2026 Data):
| Category | Average Return Rate | Best-in-Class | Warning Level |
|---|---|---|---|
| Fashion & Apparel | 25-40% | Under 18% | Above 35% |
| Beauty & Personal Care | 15-22% | Under 10% | Above 22% |
| Footwear | 30-45% | Under 25% | Above 40% |
| Home & Kitchen | 6-10% | Under 5% | Above 12% |
| Electronics | 8-12% | Under 6% | Above 15% |
| Jewellery | 12-18% | Under 8% | Above 20% |
| Baby & Kids | 10-15% | Under 8% | Above 18% |
| Sports & Fitness | 12-20% | Under 10% | Above 22% |
How to calculate ecommerce return rate: Divide total number of returned units by total number of units shipped in the same period, then multiply by 100. Some brands measure by revenue instead of unit count, which produces a different number if average return value differs from average order value.
Why Is My Ecommerce Return Rate So High?
Return rates rise for four root causes, and the mix determines your fix. Across the TrackVid platform of 1,100+ sellers, we observe the following distribution of return reasons:
The 4 Root Causes of Ecommerce Returns:
- Size or fit mismatch (35-45% of fashion returns). Customer ordered wrong size, or the actual product runs different from listed dimensions.
- Damaged or defective on arrival (15-22% of returns overall). Product arrived broken, torn, stained, or with functional defects.
- Not as described (12-18% of returns). Product looks, feels, functions differently than the listing suggested.
- First-party return fraud (10-25% of returns depending on category). Includes wardrobing (wear once, return as new), bracketing (buy multiple, keep one, return rest), empty box returns, and tag-swap fraud.
The remaining balance covers legitimate late deliveries, duplicate orders, changed minds within return policy, and shipping errors.
The critical insight from platform data: wrong-item returns and damaged-on-arrival returns are both operational failures at YOUR warehouse, not customer behavior problems. These two categories combined represent 30 to 40 percent of most brands' returns, and they are the fastest to eliminate. Size and fit issues require product-level fixes. First-party fraud requires customer-level detection. But operational returns fix in 30 to 60 days with the right verification infrastructure.
The 5-Step Framework to Reduce Ecommerce Return Rate
Step 1: Audit Your Return Data by Reason, SKU, and Customer
Before you fix anything, measure what you have. Pull the last 90 days of return data and cut it three ways.
By reason code: what percentage of your returns are size, damaged, wrong item, not as described, changed mind? The reason distribution tells you where to invest.
By SKU: which specific products drive disproportionate returns? Often 20 percent of SKUs generate 60 to 70 percent of returns. Fix or delist those SKUs first.
By customer: which customers return most often? Serial returners (5 to 10 percent of buyers) drive 30 to 40 percent of returns according to Claimlane 2026 data. This cohort needs different handling.
Most brands never do this analysis. Every reduction initiative that skips it ends up spending effort on the wrong problem.
Step 2: Fix Product Accuracy at the Listing Level
Product listings that don't match reality drive returns. The fix has three components.
Size charts: publish size charts with actual garment measurements (chest, waist, length in centimeters or inches), not just S/M/L labels. Include model wearing information (model height, model wearing size). Fashion brands adopting detailed size charts see size returns drop 15 to 25 percent within 60 days.
Product images: show the product in real use, on real bodies where applicable, from multiple angles. Studio-perfect single-angle images drive "not as described" returns.
Descriptions: specify material composition, weight, dimensions, care instructions, and country of origin. Vague descriptions leave customer expectations to imagination, and imagination always exceeds reality.
For fashion specifically, add fit notes ("runs small, size up") based on your return data. If 30 percent of small-size returns get exchanged to medium, that data belongs in the listing.
Step 3: Verify Every Dispatch With Order ID-Linked Packing Video
This is the single highest-impact step in the framework and the one most brands skip entirely.
Wrong-item and damaged-item returns collectively drive 30 to 40 percent of ecommerce returns. Both categories are packing floor problems, not customer behavior problems. The customer received something wrong or damaged because your packing process let something wrong or damaged leave the warehouse.
The fix is dispatch verification: every order gets a short packing video (15 to 30 seconds) capturing the specific product going into the specific parcel, tied to Order ID, with calibrated weight and tamper-evident seal in the same frame.
Three things happen when you deploy this at scale:
Packing accuracy improves within 2 weeks. Packers know their work is recorded. Wrong-item rates drop 40 to 60 percent within 30 days simply because packing floor discipline sharpens under camera.
Damage disputes collapse. When a "damaged on arrival" return arrives, you retrieve the dispatch video showing the product intact and sealed. Legitimate damage gets attributed to the carrier (recoverable). Fraudulent damage claims get denied (protected margin).
Wardrobing and empty-box return fraud become impossible. When a customer files "wrong item received" or "package was empty" and you have Order ID-linked packing video showing the correct product in the sealed parcel with calibrated weight, the claim collapses.
Across the TrackVid platform, sellers deploying Order ID-linked dispatch video see attempted wardrobing and empty-box claims drop 45 to 55 percent within 90 days as customers filing false claims move to easier targets.
Step 4: Upgrade Protective Packaging Against Transit Damage
Damaged-on-arrival returns split into two causes: packing damage (your fault) and transit damage (carrier's fault). Step 3 addresses attribution. Step 4 reduces occurrence.
For fragile categories (glassware, ceramics, electronics), invest in real protective packaging: cell-based inserts, double-boxing, corner protection, fragility labels visible to handlers. The cost per parcel rises marginally. The damage return rate drops significantly.
For soft goods (apparel, textiles), invest in poly mailer quality (thicker gauge, tear-resistant), tamper-evident closure, and moisture protection during monsoon or rainy season shipping.
For everything: invisible packaging is expensive packaging. What arrives crushed, torn, or wet gets returned. What arrives intact rarely does.
Step 5: Deploy Customer-Level Risk Scoring for Serial Return Abuse
The serial returner cohort (5 to 10 percent of your customers driving 30 to 40 percent of returns per Claimlane 2026 data) needs different treatment than your normal customer base. Two approaches work.
Detection. Track return rate per customer over rolling 90 and 365 day windows. Flag customers with return rates above 50 percent as high-risk. Flag customers returning consistently under wardrobing patterns (returning within 3 days of receipt) as likely fraud.
Policy differentiation. Standard customers get frictionless returns. High-risk customers get manual review, restocking fees on repeated abuse, or refund-only-after-inspection policies. This is legal in most jurisdictions when applied consistently and disclosed.
The trap most brands fall into is applying restrictive policies to everyone. That approach damages good customers to catch bad ones. Customer-level risk scoring targets the abuse without punishing the majority.
Combine this step with Step 3 (dispatch verification) and the serial abuser has nowhere to hide. Their fraud tactics stop working. Their return rate normalizes or they churn to a competitor with weaker infrastructure.
Case Study: Fashion D2C Brand, 32.4 Percent to 18.7 Percent Return Rate in 90 Days
A women's fashion and lifestyle D2C brand on the TrackVid platform started 2026 with a 32.4 percent blended return rate across their marketplace and Shopify channels. Their top three return reasons: size and fit (41 percent), damaged or defective (18 percent), and not as described (14 percent). Combined operational and merchandise loss from returns represented approximately 11 percent of gross revenue.
The team ran the 5-step framework over 90 days.
Days 1-14: Return data audit. Identified top 20 problem SKUs driving 62 percent of returns. Delisted 7 structurally unfixable SKUs. Enhanced size charts on remaining 187.
Days 15-30: Deployed Order ID-linked packing video across all dispatch stations. Enrolled 3 warehouse locations.
Days 31-60: Upgraded packaging on 4 damage-prone SKU categories. Introduced garment measurement size charts with model fit notes. Deployed WhatsApp packing video share on high-AOV orders.
Days 61-90: Implemented customer-level risk scoring. Identified 4.2 percent of customer base with return rates above 50 percent. Applied differentiated policies (manual review, no free return shipping) to this cohort.
Results at day 90:
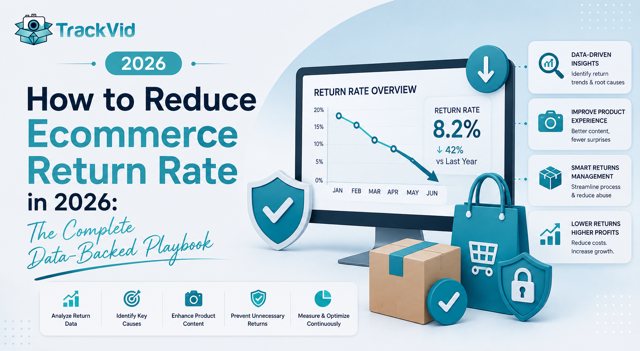
- Blended return rate dropped from 32.4 percent to 18.7 percent (down 42 percent)
- Wrong-item returns dropped 78 percent (Step 3 impact)
- Damage returns dropped 34 percent (Step 4 impact)
- Attempted wardrobing claims dropped 51 percent (Step 3 deterrent effect)
- Serial returner cohort returned to normalized rates or churned (Step 5 impact)
- Return-related operating cost dropped from 11 percent of GMV to 6.4 percent
- Net margin improved 4.6 percentage points
The single largest contribution came from Step 3. Dispatch verification alone accounted for approximately 55 percent of the total return rate reduction because it fixed both operational returns AND fraud returns simultaneously.
How to Reduce Fashion Return Rate Specifically
Fashion return rates sit structurally highest because of fit uncertainty and bracketing behavior. The 5-step framework applies fully, but three additional tactics work specifically for fashion.
Detailed size charts with garment measurements, not just size labels. Publish chest, waist, length, sleeve measurements in centimeters. Fashion brands using detailed size charts see size-related returns drop 20 to 30 percent within 60 days.
Model fit notes based on your data. "This customer is 5'8" wearing size M. Model finds it fits true to size" is more valuable than "medium available." Update fit notes quarterly from your return reason data.
Exchange-first return policy. Present customers with size exchange as the default option (with refund as secondary) when they initiate a return. Exchange-first policies convert 55 to 65 percent of intended refunds into exchanges, preserving revenue while addressing the fit issue that caused the return.
How to Reduce Damaged Returns Specifically
Damaged-on-arrival returns split three ways: packing damage (fixable), transit damage (carrier attribution problem), and fraudulent damage claims (return fraud). All three collapse against Order ID-linked dispatch video.
Dispatch video showing the intact sealed product at dispatch establishes the baseline. When damaged returns arrive, video review determines cause. Products intact at dispatch that arrive damaged: legitimate transit damage, file carrier claim, recover cost. Products intact at dispatch that arrive suspiciously damaged with weight mismatch: probable fraud, defend refund. Products damaged at dispatch: internal training gap, fix packing floor.
Without this evidence, all damaged returns get treated the same and all bear merchant cost. With this evidence, each category routes to the right resolution.
Where TrackVid Fits in the Return Reduction Framework
The 5-step framework works. Step 3 is the operational lynchpin because it fixes multiple return categories simultaneously. Deploying Step 3 manually is the hard part.
TrackVid is a video proof and claim management platform used by 1,100+ ecommerce sellers on Shopify, WooCommerce, Amazon, Flipkart, Myntra, AJIO, Nykaa, Meesho, and Snapdeal. Officially authorized by Snapdeal. Serving brands including Rare Rabbit, Wrogn, The Indian Garage Co, The Bear House, HRX, Nike, Jordan, Tommy Hilfiger, and Snitch.
For return rate reduction specifically:
- Auto-captures Order ID-linked packing video at your dispatch station without workflow changes. Setup under 30 minutes with existing warehouse cameras.
- Ties every video to Order ID, SKU, and tracking reference automatically. Retrieval in under two minutes when a return dispute lands.
- WhatsApp packing video share to customers on dispatch. Trust artifact that reduces WISMO queries AND deters return fraud simultaneously.
- Return reconciliation module that scans return delivery logs and flags weight mismatches, suspicious delivery patterns, and fake "return delivered" events couriers occasionally mark against you.
- Auto-files claims on marketplaces (Myntra, AJIO, Nykaa, Meesho, Snapdeal) cutting manual filing from 15-20 minutes to under 30 seconds per claim. 90 percent plus claim win rate across the platform.
- Serial returner detection via customer-level return pattern tracking backed by per-order video evidence.
The WROGN pilot moved claim approval from 42.3 percent (June) to 60.3 percent (July) across 868 filed claims within one month of deployment. Rare Rabbit and The Indian Garage Co show similar patterns.
In a 30-minute call, our team walks through your specific return categories, quantifies your recoverable loss from Steps 3 and 4 alone, and shows you exactly how the platform integrates with your existing dispatch operation. No commitment, no obligation.
Return Rate Reduction Audit: 5 Questions
1. What percentage of your returns are wrong-item and damaged-on-arrival combined? If above 25 percent, Step 3 (dispatch verification) alone will move your total return rate by 8 to 12 percentage points within 90 days.
2. For your last 100 returns, do you have a documented return reason for each? If not, Step 1 audit is your first move. You cannot fix what you have not measured.
3. What percentage of your customer base drives more than half your returns? If you do not know, deploy customer-level tracking before implementing any policy change.
4. How long does it take you to prove dispatch condition when a customer files a "damaged on arrival" or "wrong item received" claim? If above 30 minutes, you are absorbing preventable loss on every disputed return.
5. What is your current return rate versus your category benchmark from the table above? If you are above the warning level, structural intervention is required. Marginal fixes will not close the gap.
See exactly where your recoverable return loss is and what a structured verification system looks like in your specific operation. 30 minutes. No commitment.
Frequently Asked Questions
What is a good ecommerce return rate?
A good ecommerce return rate depends on category. Fashion and apparel best-in-class sits under 18 percent (versus 25-40 percent average). Beauty and personal care best-in-class sits under 10 percent (versus 15-22 percent). Electronics best-in-class sits under 6 percent (versus 8-12 percent). Home goods best-in-class sits under 5 percent (versus 6-10 percent). If your return rate exceeds category average, structural improvement is possible. If it exceeds the warning level, structural intervention is required.
Why is my ecommerce return rate so high?
Ecommerce return rates rise for four root causes: size or fit mismatch (35-45 percent of fashion returns), damaged or defective on arrival (15-22 percent overall), not as described (12-18 percent), and first-party return fraud including wardrobing and bracketing (10-25 percent depending on category). Without a return reason audit, brands cannot identify which cause dominates their specific business and misallocate effort accordingly.
How to calculate ecommerce return rate?
Return rate equals total returned units divided by total shipped units in the same period, multiplied by 100. If you shipped 10,000 units and 2,080 came back, your return rate is 20.8 percent. Some brands calculate by revenue instead of units. Both methods are valid but produce different numbers when average return value differs from average order value.
How to reduce fashion return rate?
Fashion return rate reduction requires three specific tactics beyond the general 5-step framework: detailed size charts with actual garment measurements in centimeters, model fit notes based on your return data ("model is 5'8" wearing size M, fits true to size"), and exchange-first return policies that convert 55-65 percent of intended refunds into size exchanges. Combined with dispatch verification (Step 3), fashion brands see return rates drop 30 to 42 percent within 90 days.
How to prevent wardrobing fraud in ecommerce?
Wardrobing fraud prevention requires two layers. First, Order ID-linked packing video at dispatch showing tags attached, accessories complete, and product in unworn condition. When a wardrobing return arrives (worn item returned as new), dispatch video defeats the claim. Second, customer-level risk scoring identifying serial returners with wardrobing patterns (returns within 3 days, high return rates, high-value items). Combined tactics reduce attempted wardrobing 45-55 percent within 90 days as fraud attempts route to easier targets.
How to identify serial returners in ecommerce?
Serial returners represent 5-10 percent of the average brand's customer base but drive 30-40 percent of all returns per Claimlane 2026 data. Identify them by tracking return rate per customer across rolling 90 and 365 day windows. Customers with return rates above 50 percent are high-risk. Customers with rapid return patterns (multiple returns within 30 days) are likely abusive. Apply differentiated policies (manual review, restocking fees, refund-after-inspection) to this cohort without penalizing your normal customer base.
Does exchange-first return policy reduce returns?
Exchange-first return policies do not reduce return initiation, but they reduce refund conversion. When customers see size exchange as the default option before refund, 55-65 percent of intended refunds convert to exchanges. This preserves revenue while addressing the fit issue causing the return. Brands running exchange-first policies see revenue retention improve 15-25 percent on returns without impacting customer satisfaction.
How does packing video reduce ecommerce returns?
Packing video reduces returns in three ways. First, wrong-item returns drop 40-60 percent within 30 days as packing floor discipline sharpens under camera. Second, damaged-on-arrival attribution moves to carriers instead of merchants, redirecting loss to recoverable insurance claims. Third, wardrobing and empty-box return fraud collapse against dispatch condition proof, dropping attempted fraud 45-55 percent within 90 days. Across the TrackVid platform of 1,100+ sellers, dispatch verification alone accounts for approximately 55 percent of total return rate reduction achieved in the 90-day framework.
What is the best return policy for D2C brands?
The best return policy for D2C brands is tiered: frictionless returns for standard customers, exchange-first as default with refund secondary, and differentiated policies for the serial returner cohort (5-10 percent of buyers). Free return shipping applies to first return per customer per 90 days. Return window of 30 days works for most categories. Restocking fees apply only to repeat abuse, not first-time returns. The goal is minimizing friction for good customers while creating friction for the small cohort driving disproportionate loss.
How long does it take to reduce ecommerce return rate?
Return rate reduction operates on a 90-day timeline for structural improvement. Weeks 1-2: return data audit and SKU-level analysis. Weeks 3-4: dispatch verification deployment (fastest single lever). Weeks 5-8: product listing accuracy fixes, size chart improvements, packaging upgrades. Weeks 9-12: customer risk scoring and policy differentiation. Brands running the full framework see return rates drop 30-45 percent by day 90. Fashion brands typically see faster gains (day 45-60) because Step 3 impact compounds fastest in high-return categories.
Sources: Claimlane Return Fraud Report 2026, National Retail Federation Return Analysis 2026, Statista Ecommerce Return Rate Benchmarks 2026, Merchant Risk Council 2026 Report, TrackVid platform data across 1,100+ sellers, WROGN pilot data (94,904 videos, 95,836 tracked orders, 868 claims filed)
TrackVid is a video proof and claim management platform used by 1,100+ ecommerce sellers on Shopify, Amazon, eBay, Flipkart, Myntra, AJIO, Nykaa, Meesho, Bol.com, Zalando, MyDeal, PayPal, and Snapdeal. Officially authorized by Snapdeal. Brands trusting TrackVid include Rare Rabbit, Wrogn, The Indian Garage Co, The Bear House, HRX, Nike, Jordan, Tommy Hilfiger, and Snitch. Learn more at trackvid.in.

Get the Marketplace Claim Recovery Checklist
A 12-point checklist used by 1,100+ sellers to recover 85-90% of marketplace claim losses. Free, instant access.
- Marketplace-specific evidence formats (AJIO, Flipkart, Amazon, Myntra)
- Claim window deadlines for every major platform
- The 6-step process that pushes approval from 85-90%
- Common rejection reasons and how to avoid them
No spam. Unsubscribe anytime. Used by sellers at Rare Rabbit, HRX, Da Milano + 1,100 more.
Stop Losing Money to Fake Returns
Join 1,100+ sellers who recover lakhs every month with TrackVid