
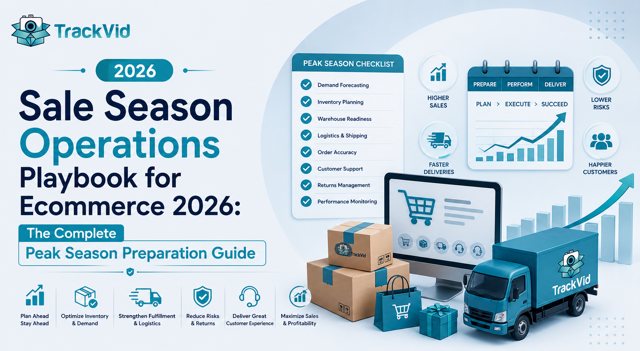
For D2C brand founders, ecommerce operations managers, warehouse teams, and customer service leads preparing for festival and Q4 peak. Updated August 2026.
Direct Answer
To prepare for sale season, start operational readiness 60-90 days before peak with demand forecast from prior year data plus growth rate plus safety buffer, scale warehouse and shipping capacity (pack stations, seasonal staff, carrier contracts, packaging inventory), prepare customer service for the WISMO surge that hits 70-80 percent of tickets during peak, deploy fraud detection and dispute defense infrastructure since fraud attempts spike 40-60 percent during sales, and run structured post-sale audit within 30 days for next-cycle learning. Brands running this framework maintain metric stability during 3-5x volume surges instead of experiencing the operational collapse most peak seasons produce.
The Problem: Sale Season Breaks Unprepared Operations at the Exact Moment It Matters Most
Sale season represents 30-45 percent of annual revenue for most D2C ecommerce brands, concentrated into 4-8 weeks of intense volume that stresses every operational system simultaneously. Q4 for Western markets. Diwali and festival cycles for India. Ramadan for MENA and Southeast Asia. Singles Day for global markets. The specific dates vary by geography, but the operational pattern is universal: 3-5x normal volume hits systems built for average conditions, and every weakness becomes catastrophic within 48 hours of the volume ramp.
The response most brands try first is to hire more warehouse and support staff for the peak weeks and hope the systems hold. This approach fails predictably. Untrained seasonal staff produce 3-5x higher error rates than experienced teams. Support teams overwhelmed by WISMO surge cannot triage legitimate delivery issues. Fraud detection built for normal volume misses the 40-60 percent fraud attempt spike that peak season attracts. Marketplace dispute filing that took 15 minutes per case during normal operations becomes impossible when 500 disputes hit in a single day. Peak season without infrastructure is not a growth opportunity; it is a controlled failure that consumes the following quarter recovering from it.
The right response is structured operational readiness starting 60-90 days before peak. The window is not optional. Brands beginning peak preparation in October for a November peak arrive at the ramp with untested systems, unstocked inventory, and undertrained staff. Brands beginning in July-August have time to test integration workflows, warm email sender reputation, build dispute defense infrastructure, train seasonal staff on real orders during shoulder season, and stress test every fulfillment path before it matters. Peak season is decided in the preparation window, not the peak weeks.
Across the TrackVid platform of 1,100+ ecommerce sellers, we consistently observe that brands entering peak season with dispatch evidence infrastructure, fraud detection systems, and structured dispute defense maintain metric stability while brands without this infrastructure experience full operational breakdown. The infrastructure gap becomes visible only under peak load, which is exactly when it is too late to fix.
Sale season is not a marketing event. It is an operational stress test. The infrastructure you built in July decides what happens in November.
What Is Peak Season in Ecommerce?
Peak season is the concentrated period of elevated buying activity that occurs multiple times per year across ecommerce markets, driven by cultural festivals, retail sales events, and marketplace promotional cycles. Peak season delivers 30-45 percent of annual revenue for most D2C brands compressed into 4-8 weeks of intense operational stress.
Global and Western markets:
- Prime Day and Prime Big Deal Days: July and October (Amazon-driven)
- Black Friday to Cyber Monday: late November
- December holiday shopping: through Christmas Eve
- Boxing Day sales: December 26 (UK, Canada, Australia)
India and South Asia festival cycle:
- Raksha Bandhan: August (jewellery, gifting)
- Onam: August-September (South India)
- Navratri: September-October (fashion, jewellery)
- Amazon Great Indian Festival: September-October
- Flipkart Big Billion Days: September-October
- Diwali: October-November (largest India sales window)
- Christmas and New Year: December
MENA and Southeast Asia:
- Ramadan and Eid: varies by year, extended multi-week demand
- Singles Day (11.11): November 11
- 12.12: December 12 (Southeast Asia)
The distinct rhythms: Western markets show 4-7 day volume spikes concentrated on named event weekends. Eastern markets run extended multi-week demand cycles across festival calendars. India specifically operates on a rolling 20+ festival calendar with each festival tied to distinct product categories. Understanding your specific market rhythm dictates your operational readiness calendar.
Peak season operational reality:
- 3-5x normal order volume
- 40-60 percent fraud attempt spike
- 70-80 percent WISMO surge in support tickets
- 20-30 percent RTO rate increase
- 15-25 percent NDR event increase
- 50-75 percent support cost premium per ticket
- Carrier capacity constraints on 3-4 peak days
- Return processing pressure extending 60-90 days post-peak
When Should I Start Preparing for Sale Season?
Preparation timeline is not flexible. The lead times on critical workstreams cannot be compressed.
Week -12 to -10 (July-August for November peak):
- Historical data analysis: prior year peak performance by category, SKU, and channel
- Demand forecast: prior year volume plus growth rate plus safety buffer
- Inventory orders: overseas products require 4-8 weeks transit; order by early August
- Warehouse space planning: additional storage for peak inventory
- Seasonal staff recruitment start: 3PL contracts, temp agency arrangements
Week -10 to -8 (August-September):
- Integration stress testing: order management, WMS, ERP, payment reconciliation
- Load testing on ecommerce platform and checkout
- Carrier contract negotiation: pickup schedules, rate confirmations, capacity commitments
- Packaging inventory: order 2-3x normal volume of standardized packaging SKUs
- Fraud detection rule tightening: adjust thresholds for peak volume patterns
- Seasonal staff onboarding: hire and begin training during shoulder season
Week -8 to -6 (September-October):
- Email and SMS sender reputation warming: gradual volume ramp to avoid delivery penalties
- Customer service capacity planning: WISMO surge modeling, staffing calculation
- Support script updates: peak-season FAQ, delay language, escalation paths
- Dispute defense infrastructure activation: dispatch evidence workflow testing
- Return processing capacity planning: warehouse space, staff, refund workflow
- Backup carrier contracts: secondary and tertiary carrier relationships for surge overflow
Week -6 to -4 (October):
- Full stress test of end-to-end workflows: order placement through delivery through return
- Peak-season staffing training completion: warehouse teams handling real orders during shoulder season
- Customer communication pre-warming: proactive notifications about expected shipping windows
- Marketing team coordination: promotion calendar aligned to fulfillment capacity
- Marketplace performance metric health check: ratings, dispute win rate, response time
Week -4 to 0 (October-November):
- Freeze mode: no new integrations, no code changes, no untested workflows
- Daily monitoring dashboards live
- On-call rotation established for operations, engineering, support
- Backup communication channels tested
- Post-peak return processing workflow validated
Week 0 to +2 (peak execution):
- Live monitoring of every workstream
- Real-time WISMO tracking
- Fraud alert response protocols active
- Marketplace dispute filing at surge volume
- Daily standups across ops, warehouse, support, engineering
Week +2 to +12 (post-peak):
- Return processing execution
- Refund reconciliation
- Dispute resolution completion
- Post-mortem structured review
- Learning capture for next cycle
The single most common preparation failure is starting too late. Brands beginning peak prep in October for a November peak carry 60-80 percent higher operational risk than brands beginning in July-August.
What Percentage of Revenue Comes From Peak Season?
Understanding peak season revenue concentration tells you the operational stakes.
| Category | Peak Season Share of Annual Revenue | Peak Windows |
|---|---|---|
| Fashion & Apparel (India) | 32-45% | Diwali plus festival cycle |
| Home & Kitchen (India) | 35-48% | Diwali plus wedding season |
| Beauty & Personal Care | 28-38% | Diwali, Christmas, Valentine's |
| Electronics | 30-42% | Diwali, Big Billion Days |
| Jewellery | 40-55% | Diwali plus wedding season |
| Fashion & Apparel (Western) | 30-40% | Black Friday to Christmas |
| Toys | 45-60% | November-December |
| Consumables | 15-25% | Distributed across year |
| Books | 20-30% | Back-to-school plus holidays |
If 40 percent of annual revenue lands in an 8-week window, that period runs at approximately 2.5x normal weekly volume. If 40 percent lands in a 4-week window, that period runs at 5x normal weekly volume.
Operational implication: infrastructure sized for average conditions cannot handle 2.5-5x volume without structural investment in the preparation window. The choice is not whether to invest in peak preparation; it is whether to invest proactively in July-August or reactively in November-December when the cost of failure has already compounded.
Revenue implication for underprepared brands:
- Missed sales from stockouts: 8-15 percent of potential peak revenue
- Missed sales from checkout capacity failure: 3-8 percent
- Cancelled orders from delivery capacity failure: 5-12 percent
- Refund cascade from operational failure: 4-10 percent
- Marketplace performance penalty from failed metrics: 15-30 percent revenue reduction for 30-60 days post-peak
Combined, an underprepared brand captures 40-55 percent of its potential peak revenue, meaning peak season becomes a loss event instead of a growth catalyst.
The 5-Step Framework for Sale Season Operations
Step 1: Forecast Demand and Prepare Inventory 60-90 Days Ahead
Peak season planning starts with data-driven demand forecast that respects real lead times.
Demand forecast methodology:
- Historical data analysis: prior year peak week volume by SKU, category, and channel
- Growth rate application: apply your annual growth rate to prior year peak numbers
- Safety buffer: add 15-25 percent buffer for demand variability
- Category concentration adjustment: account for which SKUs concentrate more heavily in peak
- New product forecast: for SKUs launched since last peak, use analog product patterns
Inventory preparation actions:
- Best-seller identification: top 20 percent of SKUs by revenue during peak
- Overseas sourcing timeline: 4-8 weeks transit means orders placed by early August for October-November peak
- Domestic sourcing timeline: 2-4 weeks lead time; orders placed by September-October
- Warehouse space allocation: stage peak inventory in dedicated peak zones near pack stations
- SKU rationalization: remove slow-movers from active picking zones to avoid confusion during volume surge
- Bundle preparation: pre-assemble popular bundles during shoulder season to save peak packing time
Common forecasting mistakes:
- Under-forecasting best-sellers (running out during peak)
- Over-forecasting long-tail SKUs (excess inventory carrying cost)
- Ignoring category concentration
- Assuming even distribution across peak weeks
- Not accounting for return velocity (returns start hitting warehouse 30-45 days into peak)
Step 2: Scale Warehouse and Shipping Capacity
Warehouse capacity is a physical constraint that cannot be improvised.
Warehouse capacity scaling actions:
- Pack station capacity: 2-3x normal pack station count during peak; verify power, WiFi, scanning equipment
- Seasonal staff planning: hire 40-100 percent additional warehouse staff; onboarding starts 8 weeks before peak
- Training during shoulder season: seasonal staff handle real orders during September-October to build competency
- Shift structure: move to 2-shift or 24-hour operations during peak weeks
- Storage buffer: additional inventory storage plus additional return processing space
Shipping and carrier capacity:
- Primary carrier contract confirmation: pickup schedules, rate cards, capacity commitments during peak weeks
- Secondary carrier relationships: for surge overflow when primary carrier hits capacity
- Tertiary emergency carriers: last-resort options priced higher but available
- Regional carrier options: for specific zones where primary carrier struggles
- Multi-carrier routing rules: automatic carrier selection based on capacity, cost, and destination
Packaging capacity:
- Right-sized packaging inventory: 2-3x normal quantities of standardized SKUs. See our Ecommerce Packaging Best Practices playbook at trackvid.in for the right-sizing framework.
- Void fill supply: kraft paper, air pillows, molded pulp inserts in surge quantities
- Tamper seal supply: water-activated tape or tear-away strip inventory
- Backup packaging suppliers: relationships with 2-3 suppliers for surge orders
Warehouse infrastructure investment: peak season is not the time to test new WMS platforms, new scanning technology, or new integration workflows. Deploy technology changes 60+ days before peak so the operation is running on tested systems during volume surge. For the accuracy discipline that keeps error rates stable under seasonal staffing, see our How to Improve Order Accuracy playbook at trackvid.in.
Step 3: Prepare Customer Service for the WISMO Surge
WISMO tickets surge to 70-80 percent of total support volume during peak season, up from 30-50 percent baseline.
Support capacity scaling:
- Support agent count: 3-4x normal capacity during peak weeks
- Seasonal support staff onboarding: 6-8 weeks before peak with real ticket handling during shoulder season
- Extended hours: 24/7 support during peak weeks including weekends
- Multichannel infrastructure: WhatsApp Business API, email, SMS, phone, live chat all active with capacity for surge
Proactive notification infrastructure:
- 5-event shipping notifications: order placed, dispatched, in-transit, out for delivery, delivered
- Multichannel delivery: WhatsApp plus email plus SMS for high-urgency events
- Predictive exception alerts: 24-hour no-movement triggers proactive customer update
- Peak-specific messaging: communicate expected shipping windows 2-3 days before peak so customers set correct expectations
WISMO reduction infrastructure:
- Branded self-service tracking page: replaces generic carrier tracking, reduces WISMO 40-50 percent
- Dispatch evidence via WhatsApp for high-value orders: eliminates "did they ship?" WISMO category entirely
- Support ticket acceleration: dispatch evidence retrievable in under 2 minutes for first-contact resolution
For the complete WISMO reduction framework, see our WISMO Reduction Playbook at trackvid.in.
Peak-specific customer communication:
- Pre-peak email: "We are expecting high volume; expected shipping windows will run 3-5 days versus normal 1-2"
- Peak-day acknowledgment: "Your order is confirmed and in queue for processing"
- Delay proactive alerts: "Your order is taking longer than normal due to peak volume; new expected date is X"
- Post-peak follow-up if applicable, explaining what happened and how it was resolved
Step 4: Deploy Fraud Detection and Dispute Defense Infrastructure
Fraud attempts spike 40-60 percent during peak season. Dispute cascades hit 30-60 days post-peak. Both require infrastructure that must be deployed before peak begins.
Fraud detection scaling:
- Fake COD order detection: tighten thresholds during peak. See our Fake COD Order Detection Playbook at trackvid.in for the 8-signal framework.
- Customer risk scoring: apply Green/Yellow/Red tier framework with more conservative Yellow tier treatment during peak. See our Customer Risk Scoring Playbook at trackvid.in.
- Bulk order pattern detection: peak season attracts organized fraud rings placing bulk fake orders
- Address verification enhancement: repeated address use across new accounts, delivery address mismatches
- Payment method scrutiny: disposable card patterns, chargeback history flags
Dispute defense infrastructure:
- Dispatch evidence on every order: Order ID-linked video with weight verification and tamper seal application. Non-negotiable during peak.
- Auto-file marketplace claims: for Myntra, AJIO, Nykaa, Meesho, Snapdeal disputes. Cuts filing time from 15-20 minutes to under 30 seconds per claim. Critical when dispute volume surges to hundreds per day.
- NDR management automation: structured response within 4 hours for every NDR event. See our NDR Management Ecommerce Playbook at trackvid.in.
- Return reconciliation: cross-reference return weight against dispatch weight to catch empty-box fraud
- Refund fraud detection: wardrobing patterns, serial return patterns, multi-account fraud rings
Post-peak dispute cascade preparation:
- Return processing capacity for 60-90 days after peak
- Marketplace dispute response SLA maintenance
- Chargeback response infrastructure (chargebacks arrive 60-90 days after original transaction)
- Refund reconciliation staff and process
Step 5: Run Structured Post-Sale Audit Within 30 Days
Peak season learning has short half-life. Structured post-mortem within 30 days captures learnings that would otherwise fade before the next preparation cycle.
Category 1 - Volume and revenue:
- Actual vs forecast by SKU, category, channel
- Stockout losses (SKUs that ran out, revenue impact)
- Overstock (SKUs with excess inventory, carrying cost)
- Peak day analysis (which days drove concentration)
Category 2 - Operational metrics:
- Order accuracy rate during peak vs baseline
- Damage rate during peak vs baseline
- WISMO share of support tickets peak vs baseline
- First-contact resolution rate peak vs baseline
- Fraud attempt volume and detection rate
- Dispute win rate peak vs baseline
Category 3 - Cost analysis:
- Fully-loaded cost per order during peak
- Support cost premium per ticket
- Warehouse labor cost per order
- Packaging cost per order
- Shipping cost per order including surge premiums
Category 4 - Customer experience metrics:
- On-time delivery rate
- Customer NPS during and post-peak
- Repeat purchase rate on peak-season customers 30-60 days after
- Marketplace rating trajectory
- Review generation and sentiment
Category 5 - Team and process learnings:
- What broke and why
- What worked better than expected
- Where seasonal staff performed vs experienced staff
- Which vendors met commitments; which did not
- Which integrations held up; which failed
Learning capture format: written document, not verbal debrief. Circulate to all peak-relevant teams within 30 days. Reference during next peak preparation cycle starting 12 weeks before subsequent peak.
The compounding benefit: brands running structured post-sale audits for 2-3 consecutive peaks build institutional knowledge that reduces preparation time and improves outcomes each cycle.
Case Study: D2C Brand, Sale Season Metrics Maintained During 4.2x Volume Surge
A men's fashion and accessories D2C brand on the TrackVid platform prepared for Diwali 2025 using this framework. Normal weekly volume: 5,600 orders. Prior year peak: 3.1x normal volume with significant operational strain (WISMO surged to 71 percent of tickets, RTO increased 28 percent, dispute win rate collapsed to 41 percent, support cost per ticket up 68 percent).
July preparation: demand forecast built from prior year data with 22 percent growth rate and 20 percent safety buffer. Overseas inventory orders placed. Warehouse space allocation completed.
August preparation: integration stress testing across WMS, ERP, ecommerce platform. Carrier contract renegotiation with capacity commitments. Seasonal staff recruitment started (40 additional warehouse staff, 25 additional support agents).
September preparation: seasonal staff onboarding with real order handling during shoulder season. Email and SMS sender reputation warming. Dispute defense infrastructure via TrackVid activated on all orders. Multichannel notification workflow tested.
October preparation: full end-to-end stress test. Peak-season customer communication pre-warming. Backup carrier contracts confirmed. Freeze mode entered by mid-October.
Peak execution: live monitoring dashboards. On-call rotation. Daily standups across teams. Real-time WISMO tracking.
Results during peak (4.2x normal volume vs prior year 3.1x):
- WISMO share of support tickets: 18 percent during peak (versus 71 percent prior year peak, versus 12 percent baseline)
- First-contact resolution rate on shipping tickets: 82 percent (versus prior year peak 44 percent)
- RTO rate during peak: 21 percent (versus prior year peak 34 percent, versus baseline 19 percent)
- Order accuracy rate during peak: 98.9 percent (versus prior year peak 94.2 percent, versus baseline 99.4 percent)
- Fraud attempts blocked: 4.2 percent of orders (up from baseline 1.8 percent as fraud rings targeted peak)
- Fake COD orders detected pre-dispatch: 89 percent (versus prior year 34 percent)
- Marketplace dispute win rate: 87 percent (versus prior year peak 41 percent, versus baseline 92 percent)
- Support cost per ticket: up 12 percent versus baseline (versus prior year peak up 68 percent)
- On-time delivery rate: 91 percent (versus prior year peak 74 percent)
- Peak revenue: ₹8.2 crore in peak weeks (versus ₹5.4 crore prior year, up 52 percent)
- Post-peak repeat purchase rate on peak-season customers: 34 percent within 60 days (versus prior year 19 percent)
The single largest contribution came from Step 3 (WISMO reduction infrastructure) plus Step 4 (fraud detection and dispute defense combined), accounting for approximately 70 percent of the metric stability during volume surge.
See how dispatch evidence infrastructure keeps dispute win rates stable during peak volume surge. 30 minutes. No commitment.
How Does Fraud Change During Sale Season?
Fraud attempts spike 40-60 percent during sale season and change character in ways worth understanding.
Volume spike: total fraud attempts increase 40-60 percent as organized fraud rings specifically target peak periods when merchant detection thresholds may be relaxed to handle legitimate volume.
Fake COD orders specifically: COD refusal patterns intensify during peak because fraudulent buyers rely on merchants shipping without payment. Detection requires tighter fake COD frameworks (see our Fake COD Order Detection Playbook at trackvid.in).
Address fraud patterns: repeated addresses across new accounts, delivery address mismatches with billing.
Bulk order fraud: organized rings placing high-value orders using disposable payment methods with intent to receive product and dispute charges post-delivery.
Wardrobing surge: buyers ordering, using product briefly, and returning during peak. Fashion category specifically vulnerable.
Empty-box return fraud: buyers accepting parcels, keeping products, and claiming empty parcels arrived. Only defended through dispatch evidence with tamper-evident sealing.
Multi-account fraud: single fraud actor operating multiple customer accounts to bypass single-account limits.
Post-peak chargeback cascade: legitimate and fraudulent chargebacks arrive 60-90 days after peak transactions. Response infrastructure must survive the delay.
For the complete framework combining these elements, see our Customer Risk Scoring Playbook and NDR Management Playbook at trackvid.in.
Where TrackVid Fits in Your Sale Season Operations Stack
Steps 1-3 need standard ecommerce infrastructure (demand forecasting via analytics, warehouse capacity via 3PL relationships, support capacity via seasonal hiring and helpdesk platforms). Step 4 (fraud detection and dispute defense) is where TrackVid becomes decisive during peak.
TrackVid is a video proof and claim management platform used by 1,100+ ecommerce sellers on Shopify, WooCommerce, Amazon, Flipkart, Myntra, AJIO, Nykaa, Meesho, and Snapdeal. Officially authorized by Snapdeal. Brands using TrackVid include Rare Rabbit, Wrogn, The Indian Garage Co, The Bear House, HRX, Nike, Jordan, Tommy Hilfiger, and Snitch.
For sale season operations specifically, TrackVid delivers:
- Order ID-linked dispatch video on every order without workflow changes. Critical during peak when dispute volume surges to hundreds per day. Retrievable in under 2 minutes for support first-contact resolution.
- Auto-files claims on marketplaces (Myntra, AJIO, Nykaa, Meesho, Snapdeal) for the peak dispute surge, cutting manual filing from 15-20 minutes to under 30 seconds per claim. Peak brands filing 500+ disputes daily cannot survive without automated filing.
- 90 percent plus dispute win rate maintenance during peak volume, versus 30-40 percent industry collapse when disputes exceed manual defense capacity.
- Post-delivery empty-box fraud elimination via dispatch weight vs return weight reconciliation. Peak season empty-box fraud attempts spike 60-90 percent.
- Fake NDR detection through GPS-based dispatch verification preventing fraudulent NDR events during peak carrier stress periods.
- Support ticket acceleration through instant dispatch evidence retrieval keeping first-contact resolution above 80 percent during WISMO surge.
For related workflows across the operational readiness and dispute defense stack, see our Ecommerce Packaging Best Practices playbook, How to Improve Order Accuracy playbook, WISMO Reduction Playbook, Customer Trust Building playbook, and How to Get More Sales From Your Online Store playbook at trackvid.in.
WROGN's pilot data shows the pattern clearly. Across 95,836 tracked orders and 868 claims filed, systematic dispatch evidence combined with automated claim filing moved dispute approval from 42.3 percent (June) to 60.3 percent (July) within one month, demonstrating the exact infrastructure needed to survive peak season dispute cascades.
In a 30-minute call, our team walks through your specific sale season operational risks, quantifies the dispute defense opportunity, and shows you exactly how the infrastructure integrates with your existing peak season workflow. No commitment, no obligation.
5-Question Sale Season Readiness Audit
1. When did you start peak season preparation? If less than 12 weeks before peak, you are carrying 60-80 percent higher operational risk than brands beginning 12+ weeks in advance.
2. What is your current WISMO reduction infrastructure? If you rely on email-only notifications and generic carrier tracking, peak season WISMO will surge to 70-80 percent of tickets and support cost will explode.
3. Do you have dispatch evidence infrastructure deployed on every order? Without it, peak dispute win rates collapse from 90 percent baseline to 40 percent, converting revenue into refunds and chargebacks.
4. Do you have fake COD detection, customer risk scoring, and NDR management automation running? Without these, fraud attempts spike 40-60 percent during peak with no defensive response capacity.
5. Do you run structured post-sale audits within 30 days of peak completion? Without written learning capture, the same failures repeat every peak cycle indefinitely.
See exactly where your sale season operational gaps sit and how dispatch evidence maintains dispute win rates during peak volume surge. 30 minutes. No commitment.
Frequently Asked Questions
How to prepare for sale season in ecommerce?
Start operational readiness 60-90 days before peak with demand forecast from prior year data plus growth rate plus safety buffer, scale warehouse and shipping capacity, prepare customer service for WISMO surge to 70-80 percent of tickets, deploy fraud detection and dispute defense since fraud attempts spike 40-60 percent during sales, and run structured post-sale audit within 30 days for next-cycle learning.
What is peak season in ecommerce?
Peak season is a concentrated period of elevated buying activity driven by cultural festivals, retail sales events, and marketplace promotional cycles. Western markets: Black Friday to Cyber Monday, December holiday shopping. India: Diwali plus festival cycle including Amazon Great Indian Festival and Flipkart Big Billion Days. MENA and Southeast Asia: Ramadan, 11.11, 12.12. Delivers 30-45 percent of annual revenue in 4-8 weeks.
When should I start preparing for sale season?
Start 12 weeks before peak (July-August for November peak). Overseas inventory orders require 4-8 weeks transit; place by early August. Seasonal staff onboarding starts 8 weeks before peak. Integration stress testing 10 weeks before. Sender reputation warming 8 weeks before. Freeze mode by 4 weeks before peak. Brands starting less than 12 weeks in advance carry 60-80 percent higher operational risk.
What percentage of revenue comes from peak season?
Category-specific: jewellery 40-55 percent, home and kitchen 35-48 percent, fashion 32-45 percent, electronics 30-42 percent, beauty 28-38 percent, toys 45-60 percent, consumables 15-25 percent. Peak concentrations of 40 percent revenue in 8 weeks equals 2.5x normal weekly volume. Underprepared brands capture only 40-55 percent of potential peak revenue due to operational failures.
How does fraud change during sale season?
Fraud attempts spike 40-60 percent as organized rings target relaxed detection thresholds. Fake COD orders intensify. Address fraud patterns emerge. Bulk order fraud with disposable payment methods. Wardrobing surge in fashion. Empty-box return fraud increases 60-90 percent. Multi-account fraud rings activate. Chargeback cascade arrives 60-90 days post-peak.
How to handle sale season customer service?
Scale support 3-4x normal capacity. Onboard seasonal staff 6-8 weeks before peak. Extended 24/7 hours during peak weeks. Deploy multichannel infrastructure (WhatsApp, email, SMS, phone, chat). Proactive 5-event shipping notifications. Predictive exception alerts for 24-hour delays. Branded tracking page. Dispatch evidence for high-value orders. Pre-peak communication about expected 3-5 day shipping windows.
How to prepare warehouse for peak season?
2-3x normal pack station count with verified power, WiFi, scanning equipment. 40-100 percent additional warehouse staff hired 8 weeks before peak with real-order training during shoulder season. Move to 2-shift or 24-hour operations during peak. Additional inventory storage and return processing space. Primary plus secondary plus tertiary carrier relationships with capacity commitments. Do not deploy new technology during peak.
What is a good sale season preparation timeline?
Week -12 to -10 (July-August): historical analysis, demand forecast, inventory orders, staff recruitment. Week -10 to -8: integration testing, carrier negotiation, packaging inventory. Week -8 to -6: sender reputation warming, support capacity, dispute defense activation. Week -6 to -4: end-to-end stress testing, staff training completion. Week -4 to 0: freeze mode, monitoring live. Week +2 to +12: post-peak execution and learning capture.
Does dispatch evidence help during peak season?
Yes. During peak, dispute volume surges to hundreds per day. Dispatch evidence via Order ID-linked video maintains dispute win rate at 90 percent versus industry collapse to 30-40 percent when manual defense cannot scale. It also eliminates empty-box return fraud that spikes 60-90 percent during peak. Support ticket first-contact resolution maintains above 80 percent versus collapse to 45 percent during WISMO surge.
How to prepare for Diwali sale as a D2C brand?
Diwali is India's largest ecommerce sales window (October-November). Preparation starts July-August with festival-specific demand forecast (home decor, fashion, jewellery, electronics all concentrate here). Coordinate with Amazon Great Indian Festival and Flipkart Big Billion Days timing. Prepare for extended multi-week demand across Raksha Bandhan through Diwali. WhatsApp customer service infrastructure is critical. Dispatch evidence and fraud detection deployed by August.
Sources: Celigo Peak Season Preparation Guide 2026, Digital Applied Q4 Peak Season Playbook 2026, WebBee Global Peak Season Checklist 2026, eFulfillment Service Ecommerce Calendar 2026, AppBrew India Festive Marketing Calendar 2026, BQool Amazon Peak Season Analysis 2026, 10xCrew Ecommerce Calendar 2026, TrackVid platform data across 1,100+ sellers, WROGN pilot data (94,904 videos, 95,836 tracked orders, 868 claims filed)
TrackVid is a video proof and claim management platform used by 1,100+ ecommerce sellers on Shopify, Amazon, eBay, Flipkart, Myntra, AJIO, Nykaa, Meesho, Bol.com, Zalando, MyDeal, PayPal, and Snapdeal. Officially authorized by Snapdeal. Brands trusting TrackVid include Rare Rabbit, Wrogn, The Indian Garage Co, The Bear House, HRX, Nike, Jordan, Tommy Hilfiger, and Snitch. Learn more at trackvid.in.

Get the Marketplace Claim Recovery Checklist
A 12-point checklist used by 1,100+ sellers to recover 85-90% of marketplace claim losses. Free, instant access.
- Marketplace-specific evidence formats (AJIO, Flipkart, Amazon, Myntra)
- Claim window deadlines for every major platform
- The 6-step process that pushes approval from 85-90%
- Common rejection reasons and how to avoid them
No spam. Unsubscribe anytime. Used by sellers at Rare Rabbit, HRX, Da Milano + 1,100 more.
Stop Losing Money to Fake Returns
Join 1,100+ sellers who recover lakhs every month with TrackVid