
For D2C brand founders, ecommerce CFOs, finance leads, and operations managers analyzing where profit actually goes. Updated August 2026.
Direct Answer
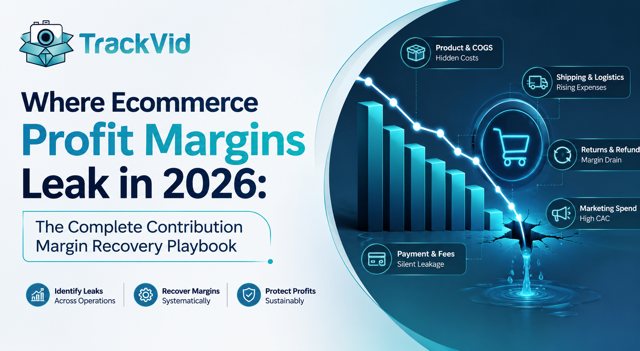
Where ecommerce profit margins leak splits into 5 major categories: acquisition (ad spend consuming 20-35 percent of revenue as CAC surged 60 percent over 5 years), operations (packaging waste, damage rate, DIM weight surcharges, accuracy failures totaling 4-9 percent of revenue), loss prevention (RTO, fake COD, NDR, empty-box fraud totaling 5-12 percent of revenue), post-purchase (WISMO support overhead, chargebacks, refund fraud totaling 2-6 percent of revenue), and retention gaps (missing repeat purchase infrastructure costs 5-15 percent of revenue in opportunity). Median D2C contribution margin fell from 35 percent (2021) to 22 percent (2025). Structural infrastructure across all 5 categories recovers 8-15 percentage points of contribution margin within 90 days, converting operational leaks into profit that flows to the bottom line.
The Problem: Your Gross Margin Is a Lie, and Your Contribution Margin Is Where the Real Story Sits
Ecommerce founders look at a 60-70 percent gross margin on their Shopify dashboard and assume the business is healthy. The gross margin figure is technically correct and completely misleading. It tells you the gap between production cost and selling price is attractive enough to manufacture the product. It tells you nothing about whether selling that product actually makes money after ads, fulfillment, returns, chargebacks, and support costs are properly loaded.
Median D2C contribution margin has compressed from 35 percent in 2021 to 22 percent in 2025, and the trend continues into 2026. Customer acquisition costs have surged approximately 60 percent over the past 5 years. Median D2C brands now spend ₹10,800 to ₹13,000 to acquire a single customer. A real ₹6,225 D2C apparel order yields just ₹547 in net profit (8.8 percent) after COGS at 35 percent, ad spend at 25 percent, shipping and returns at 17 percent, platform fees at 2.9 percent, and payment processing at 3.3 percent are fully allocated. The gap between reported margin and real margin runs 5-8 percentage points at typical operations.
The response most brands try first is to cut variable costs bluntly: cheaper packaging, reduced support headcount, marketing budget freeze. This approach fails predictably. Cheaper packaging drives higher damage rates. Reduced support drives higher churn. Marketing cuts collapse acquisition and shrink the customer base that feeds retention economics. Blunt cost cutting produces short-term margin improvement followed by 60-90 day margin collapse across compounding leaks.
The right response is to identify where margin actually leaks across the 5 categories mapped in this framework and deploy structural infrastructure that plugs multiple leaks with the same investment. The most valuable infrastructure investments plug 3-5 leak categories simultaneously through evidence chains, automation, and communication systems. Brands running this framework consistently recover 8-15 percentage points of contribution margin within 90 days without cutting a single legitimate cost line.
Across the TrackVid platform of 1,100+ ecommerce sellers, we consistently observe that dispatch evidence infrastructure plugs 6 distinct margin leak categories simultaneously (damage disputes, empty-box fraud, wrong-item claims, chargeback defense, return fraud, support cost overhead). This is the compounding effect single-purpose margin optimization misses. A single infrastructure investment that plugs 6 leaks produces 3-5x higher ROI than 6 separate investments plugging one leak each.
Your gross margin tells you if the product is worth making. Your contribution margin tells you if the business is worth running. Only one of those numbers matters.
What Is the Difference Between Gross Margin and Contribution Margin?
Understanding this distinction is where ecommerce profit analysis begins. Confusion between these two metrics is why most brands overestimate their profitability by 50-80 percent.
Gross margin formula:
Gross Margin = (Revenue - COGS) / Revenue × 100
Gross margin measures only the gap between production cost and selling price. It excludes ad spend, fulfillment, shipping, returns, platform fees, payment processing, and every other variable cost that determines whether a sale actually generates profit.
Contribution margin formula:
Contribution Margin = Revenue - COGS - Shipping/Fulfillment - Attributed Ad Spend - Returns Cost - Platform Fees - Payment Processing
Contribution margin measures the actual dollars remaining after every variable cost associated with acquiring, fulfilling, and delivering the order. This is the number that tells you whether the business generates cash to cover fixed costs and produce profit.
The gap illustration:
A brand shows 70 percent gross margin on a ₹6,225 apparel order. After proper cost loading:
- Revenue: ₹6,225
- COGS: ₹2,179 (35 percent)
- Ad spend attribution: ₹1,556 (25 percent CAC allocation)
- Shipping and returns: ₹1,058 (17 percent)
- Platform fees: ₹181 (2.9 percent)
- Payment processing: ₹205 (3.3 percent)
- Net contribution margin: ₹1,046 (16.8 percent)
The 70 percent gross margin was directionally correct for pricing decisions. It was completely misleading for business viability decisions. The 16.8 percent contribution margin is the number that determines whether this order actually funds the business.
The compounding hidden cost problem:
Most brands miss additional variable costs that further compress contribution margin:
- Damage and reshipment: 1-3 percent of revenue
- Empty-box fraud: 0.5-2 percent
- Chargeback losses: 0.3-1.5 percent
- Support cost overhead (WISMO, disputes): 1-3 percent
- DIM weight surcharges: 0.5-1.5 percent
- Refund fraud (wardrobing): 0.5-2 percent
- Fake NDR cost: 0.5-1 percent
- Marketplace performance penalties: variable but material
Adding these to the framework moves the calculated contribution margin down another 4-14 percentage points to true contribution margin of 6-15 percent for typical brands. This is why brands showing "healthy" 70 percent gross margins fail to achieve profitability.
What Is a Good Contribution Margin for Ecommerce?
Understanding benchmark performance tells you where the opportunity sits.
Contribution margin benchmarks by category (2026):
| Category | Median Contribution Margin | Best-in-Class | Warning Level |
|---|---|---|---|
| Beauty & Personal Care | 25-35% | 40-50% | Below 20% |
| Fashion & Apparel | 15-25% | 30-40% | Below 12% |
| Consumables/Supplements | 30-45% | 50-60% | Below 25% |
| Electronics Accessories | 15-22% | 25-32% | Below 10% |
| Home & Kitchen | 18-28% | 30-40% | Below 15% |
| Jewellery | 25-40% | 45-55% | Below 20% |
| Food & Beverage | 20-30% | 35-45% | Below 15% |
- D2C brands (owned traffic + Shopify/WooCommerce): 8-15 percent net profit margin (median)
- Marketplace-first brands (Amazon FBA, Flipkart, Myntra): 3-8 percent net profit margin
- Hybrid brands: 5-12 percent net profit margin
- Dropshipping: 15-25 percent net margin considered healthy; below 10 percent dangerous
By revenue scale:
- Under ₹2 crore annual revenue: 20-35 percent contribution margin possible with lean operations
- ₹2-10 crore ("messy middle" start): 15-25 percent contribution margin, fixed cost drag begins
- ₹10-50 crore ("full messy middle"): 10-20 percent contribution margin, steepest compression
- Above ₹50 crore: 15-25 percent contribution margin returns with scale efficiency
The scale paradox: contribution margin does not improve linearly with revenue growth. The ₹10-50 crore band experiences the steepest margin compression because fixed costs (team, technology, warehouse capacity) scale ahead of revenue efficiency. Brands crossing this band successfully deploy structural infrastructure that improves per-order economics rather than assuming scale automatically improves margins.
If your contribution margin sits below the category warning level, structural leak identification and plugging is the fastest single revenue lever available. A 5 percentage point contribution margin recovery on ₹10 crore annual revenue equals ₹50 lakh flowing directly to profit.
Where Do Ecommerce Profits Actually Leak? The 5 Categories
Understanding where ecommerce profit margins leak is the prerequisite to plugging them. Ecommerce profit leaks concentrate in 5 categories that compound with each other.
Category 1 - Acquisition Cost Leaks (Growth Cluster Adjacent)
What leaks here:
- Ad spend inefficiency: 20-35 percent of revenue on paid channels with declining ROAS
- CAC inflation: 60 percent CAC increase over 5 years continues into 2026
- Wasted spend on non-converting audiences
- Attribution errors overstating channel performance
- Free shipping threshold subsidy: ₹300-800 per order absorbed
- Cart abandonment: 70-75 percent of committed buyers exit before payment (opportunity cost 3-8 percent)
Typical revenue impact: ad spend consumes 20-35 percent of revenue. Inefficiency within that spend costs additional 5-15 percent of what could be productive spend.
Where to plug: conversion rate optimization to improve return on existing ad spend. See our How to Get More Sales From Your Online Store playbook at trackvid.in for the 3-lever compounding math framework. Cart recovery infrastructure. Attribution accuracy improvement (blended MER over ROAS).
Category 2 - Operational Cost Leaks (Operations Cluster)
What leaks here:
- Packaging waste from oversized packaging: DIM weight surcharges add 15-30 percent to shipping cost
- Damage from insufficient protection: 10-15 percent damage rate on typical operations
- Order accuracy failures: 2-4 percent error rate translates to full-cost losses of ₹1,500-3,000 per error
- Wrong-item disputes without evidence defense
- Warehouse labor inefficiency from poor slotting
- Return processing overhead scaling with volume
Typical revenue impact: 4-9 percent of revenue lost to operational inefficiencies across packaging, damage, accuracy, and returns.
Where to plug: structural infrastructure across packaging, accuracy, and dispatch evidence. See our Ecommerce Packaging Best Practices playbook, How to Improve Order Accuracy playbook, and How to Reduce WISMO Queries playbook at trackvid.in for the complete frameworks.
Category 3 - Loss Prevention Leaks (Loss Prevention Cluster)
What leaks here:
- Return rate above category benchmark: costs 3-8 percent of revenue
- RTO in COD-heavy markets: 25-35 percent RTO rate costs 2-5 percent of revenue in India
- Fake COD orders shipped without payment: 8-15 percent of COD orders never convert
- NDR events left unresolved: 15-25 percent conversion versus best-in-class 45-60 percent
- Empty-box return fraud: 0.5-2 percent of revenue silently drained
- Wrong-item fraudulent claims: default against merchant without dispatch evidence
- Fake NDR events: cost 0.5-1 percent of revenue
Typical revenue impact: 5-12 percent of revenue lost to loss prevention gaps.
Where to plug: integrated loss prevention infrastructure across returns, RTO, fraud detection, NDR management, and dispatch evidence. See our How to Reduce Ecommerce Return Rate playbook, How to Reduce RTO in Ecommerce playbook, Fake COD Order Detection playbook, Customer Risk Scoring playbook, and NDR Management Ecommerce playbook at trackvid.in.
Category 4 - Post-Purchase Cost Leaks (Growth + Operations)
What leaks here:
- WISMO tickets consuming 30-50 percent of support volume (surging to 70-80 percent during peak)
- Support cost per ticket: ₹250-500 fully loaded in India
- Escalations from failed first-contact resolution
- Chargeback losses: 0.3-1.5 percent of revenue
- Dispute filing labor: 15-20 minutes per manual claim
- Customer service overhead scaling faster than revenue
- Marketplace penalty from failed response SLAs
Typical revenue impact: 2-6 percent of revenue lost to post-purchase cost overhead and missed dispute defense.
Where to plug: proactive shipping notifications, branded tracking, dispatch evidence for support acceleration, auto-file dispute infrastructure. See our WISMO Reduction playbook and Post-Purchase Experience playbook at trackvid.in.
Category 5 - Retention Opportunity Leaks (Growth Cluster)
What leaks here:
- Missing repeat purchase infrastructure: RPR below 20 percent when 40 percent is achievable
- Post-purchase silence in the 60-day window (3x loyalty predictor)
- Generic segmentation missing value-tier differentiation
- No review generation engine reducing new-customer conversion
- No trust building infrastructure protecting brand credibility
- Cart-abandoner recovery gaps
Typical revenue impact: 5-15 percent of revenue lost as opportunity cost when retention infrastructure is missing.
Where to plug: structured retention infrastructure across post-purchase, RPR acceleration, trust building, and review generation. See our How to Increase Repeat Purchase Rate playbook, How to Build Customer Trust in an Online Store playbook, and How to Get More Product Reviews and Protect Ratings playbook at trackvid.in.
Total leak potential across 5 categories: 15-35 percent of revenue at brands with structural gaps. Best-in-class brands reduce total leakage to 5-10 percent through infrastructure investment.
The 5-Step Framework to Plug Where Ecommerce Profit Margins Leak
Step 1: Calculate Your True Contribution Margin (Not Gross Margin)
You cannot improve what you cannot measure correctly. Start with clean baseline data across every variable cost category.
Contribution margin formula (comprehensive):
Contribution Margin = Revenue - COGS - Shipping/Fulfillment - Attributed Ad Spend - Return Costs - Platform Fees - Payment Processing - Damage/Reshipment - Fraud Losses - Support Cost Attribution - Chargeback Losses
Measurement setup:
- Weekly tracking of contribution margin at overall and SKU levels
- Channel-level contribution margin (D2C vs Amazon vs Flipkart vs Myntra)
- Cohort-level contribution margin (new vs repeat customers)
- Full-cost tracking including compound effects (not just direct costs)
- Cross-reference with monthly P&L to catch attribution errors
Common measurement mistakes:
- Using gross margin as proxy for profitability
- Attributing all ad spend to "acquisition" without allocating to specific SKUs
- Ignoring free shipping subsidy as a real cost
- Missing damage and empty-box fraud in accounting
- Treating chargebacks as one-off events instead of persistent cost line
- Not allocating support cost to SKU or channel
The measurement discipline: brands measuring true contribution margin weekly recover 3-5x more margin than brands measuring only gross margin. Visibility drives investment in the structural fixes below.
Step 2: Identify the 3-5 Highest-Percentage Leak Categories
Once true contribution margin is measured, identify where the largest leaks concentrate. This is where your infrastructure investment gets prioritized.
Diagnostic questions:
- Which of the 5 leak categories consumes the largest percentage of revenue?
- Which leaks are structural (require infrastructure) vs tactical (require better execution)?
- Which leaks compound with each other (fixing one improves multiple)?
- Which leaks have the shortest payback timeline on infrastructure investment?
Common leak concentration patterns:
- Fashion D2C: returns (Category 3) + retention (Category 5) + WISMO (Category 4) concentrate leaks
- Beauty D2C: damage (Category 2) + retention (Category 5) + review generation (Category 5) concentrate
- Electronics: fraud (Category 3) + damage (Category 2) + dispute defense (Category 4) concentrate
- Consumables: retention (Category 5) + subscription infrastructure (Category 5) + shipping cost (Category 2) concentrate
- Marketplace-first: platform fees (Category 1) + fraud (Category 3) + dispute defense (Category 4) concentrate
Prioritization framework:
- Immediate (30-day payback): WISMO reduction, dispatch evidence, cart abandonment recovery
- Short-term (60-day payback): order accuracy, fraud detection, review generation infrastructure
- Medium-term (90-day payback): retention infrastructure, packaging optimization, comprehensive trust signals
- Long-term (120+ day payback): brand building, customer LTV optimization, marketplace expansion
Step 3: Plug Operational Leaks Through Structural Infrastructure
Operational leaks (Category 2) are typically the highest-impact starting point because operational improvements compound with every downstream category.
Operational leak plugs:
- Right-size packaging to 3-5 SKU sizes covering 85 percent of orders (cuts DIM weight surcharges 15-30 percent)
- Deploy barcode scanning validation at pick and pack stations (reduces picking errors 60-75 percent)
- Order ID-linked dispatch video at every packing station (enables downstream fraud defense)
- Weight verification at pack station (catches quantity and packaging errors)
- Tamper-evident sealing visible in dispatch video (eliminates empty-box fraud category)
- Weekly root-cause analysis on operational errors (prevents recurrence)
Compounding effect: dispatch evidence infrastructure deployed here plugs leaks in Categories 2, 3, and 4 simultaneously. Single investment, multiple leak plugs.
For complete workflows, see our Ecommerce Packaging Best Practices playbook and How to Improve Order Accuracy playbook at trackvid.in.
Step 4: Plug Loss Prevention Leaks Through Integrated Fraud Defense
Loss prevention leaks (Category 3) drain the largest silent percentage of revenue at most brands. Integrated infrastructure across returns, RTO, fraud detection, and NDR delivers cascading improvement.
Loss prevention leak plugs:
- Return rate reduction through better product page trust signals, size guides, review depth, and return policy design (see our How to Reduce Ecommerce Return Rate playbook at trackvid.in)
- RTO reduction in COD-heavy markets through address verification, prepaid nudging, and delivery confirmation (see our How to Reduce RTO in Ecommerce playbook at trackvid.in)
- Fake COD detection through 8-signal behavioral framework (see our How to Detect Fake COD Orders Before Shipping playbook at trackvid.in)
- Customer risk scoring with Green/Yellow/Red tier framework (see our Customer Risk Scoring playbook at trackvid.in)
- NDR management automation within 4 hours of NDR event (see our NDR Management Ecommerce playbook at trackvid.in)
- Empty-box fraud detection through dispatch weight vs return weight reconciliation
- Wrong-item claim defense through Order ID-linked dispatch video
Compounding effect: dispatch evidence infrastructure from Step 3 provides the evidence chain that enables 90 percent plus dispute win rates versus 30-40 percent without evidence. Same infrastructure, multiple category plugs.
Step 5: Plug Post-Purchase Cost Leaks and Retention Gaps
Post-purchase leaks (Category 4) and retention gaps (Category 5) are where the largest opportunity cost hides. Fixing these transforms customer LTV economics.
Post-purchase and retention leak plugs:
- WISMO reduction through proactive multichannel shipping notifications, branded tracking, predictive exception alerts (60-70 percent WISMO reduction within 60 days; see our How to Reduce WISMO Queries playbook at trackvid.in)
- Support ticket acceleration through dispatch evidence enabling 85-90 percent first-contact resolution versus 55-65 percent without
- Post-purchase behavioral loop targeting the 60-day loyalty window (see our Post-Purchase Experience playbook and How to Increase Repeat Purchase Rate playbook at trackvid.in)
- Trust signal infrastructure including verified reviews, dispatch evidence, transparent policies (see our How to Build Customer Trust in an Online Store playbook at trackvid.in)
- Review generation engine with multichannel requests, category-specific timing, photo/video incentives (see our How to Get More Product Reviews and Protect Ratings playbook at trackvid.in)
- Auto-file marketplace claims for chargeback and dispute defense at scale
- Sale season readiness infrastructure (see our Sale Season Operations Playbook at trackvid.in)
The compounding math: each retention lever compounds with the others through repeat purchase rate multiplication. Category 5 alone can recover 5-15 percent of revenue in opportunity when infrastructure is deployed correctly.
Case Study: D2C Brand, Contribution Margin 8.2% to 19.4% in 90 Days
A men's fashion and accessories D2C brand on the TrackVid platform started 2026 with 8.2 percent true contribution margin on ₹42 lakh monthly revenue. Their gross margin appeared healthy at 68 percent. The gap to contribution margin came from the full leak stack: acquisition 27 percent of revenue, operations 6.8 percent, loss prevention 8.4 percent, post-purchase 3.9 percent, retention opportunity cost 12 percent. Total leak: approximately 38 percentage points below gross margin.
Days 1-14: True contribution margin measurement setup. SKU-level, channel-level, and cohort-level tracking. Historical 90-day data analysis. Identified leak concentration: loss prevention (8.4 percent) + retention (12 percent) + post-purchase (3.9 percent) accounted for 24.3 percentage points of the gap.
Days 15-30: Step 3 operational infrastructure deployment. Right-sized packaging from 11 SKUs to 4 sizes. Barcode scanning at pick and pack stations. Order ID-linked dispatch video via TrackVid on every packing station. Weight verification. Tamper-evident sealing.
Days 31-60: Step 4 loss prevention infrastructure. Fake COD detection with 8-signal framework. Customer risk scoring with Green/Yellow/Red tiers. NDR management automation within 4 hours. Return weight reconciliation. Wrong-item claim defense via dispatch evidence.
Days 61-90: Step 5 post-purchase and retention infrastructure. WISMO reduction via multichannel notifications and branded tracking. Post-purchase behavioral loop at day 3, 7, 14, 60. Trust signal infrastructure with verified reviews and dispatch evidence. Auto-file marketplace claims. Review generation engine.
Results at day 90 (measured through complete Q3 P&L reconciliation):
- Return rate: 28 percent to 22 percent (down 21 percent)
- Damage rate: 11 percent to 3.8 percent (down 65 percent)
- Order accuracy: 96.2 percent to 99.4 percent (down error rate from 3.8 percent to 0.6 percent)
- Fake COD detection: 12 percent orders at risk to 3.4 percent actually shipped
- NDR recovery rate: 15 percent to 48 percent (up 220 percent)
- WISMO share of support tickets: 38 percent to 12 percent
- First-contact resolution on shipping tickets: 61 percent to 88 percent
- Empty-box fraud losses: eliminated (from 1.9 percent to 0.1 percent)
- Wrong-item dispute win rate: 34 percent to 92 percent
- Chargeback losses: 1.2 percent of revenue to 0.4 percent
- Support cost per order: down 47 percent
- Review generation rate: 3 percent to 16 percent
- 60-day RPR: 12 percent to 31 percent
- 90-day RPR: 22 percent to 44 percent
True contribution margin recovery:
- Acquisition: 27 percent to 24.5 percent of revenue (2.5 point improvement from conversion optimization)
- Operations: 6.8 percent to 2.9 percent (3.9 point improvement)
- Loss Prevention: 8.4 percent to 2.6 percent (5.8 point improvement)
- Post-Purchase: 3.9 percent to 1.4 percent (2.5 point improvement)
- Retention Opportunity: 12 percent to 4.5 percent (7.5 point improvement)
Total contribution margin: 8.2 percent to 19.4 percent (11.2 percentage points recovered)
At ₹42 lakh monthly revenue growing to ₹79 lakh after retention infrastructure took effect, the 11.2 percentage point contribution margin recovery equals approximately ₹1.42 crore additional annual profit on the same operational base. Zero incremental ad spend contributed to this gain. The infrastructure investment (TrackVid, WMS scanning integration, notification platforms) paid back within 45 days.
The single largest contribution came from Step 4 (loss prevention infrastructure) plus Step 5 (retention infrastructure) combined, accounting for approximately 68 percent of the total margin recovery. The dispatch evidence layer specifically plugged 6 distinct leak categories with one infrastructure investment: damage disputes, empty-box fraud, wrong-item claims, chargeback defense, support acceleration, and marketplace claim automation.
See how dispatch evidence plugs 6 margin leak categories simultaneously and quantify the contribution margin recovery opportunity in your operation. 30 minutes. No commitment.
How Do You Calculate True Ecommerce Profit Margin?
The comprehensive contribution margin calculation is the operational metric that matters most.
Full contribution margin formula:
Contribution Margin = Revenue - COGS - Shipping/Fulfillment - Attributed Ad Spend - Return Costs - Platform Fees - Payment Processing - Damage/Reshipment - Fraud Losses - Support Cost Attribution - Chargeback Losses
Line-by-line calculation guidance:
Revenue: gross sales minus refunds and returns (not GMV). Include shipping revenue if customer paid; exclude if you absorbed shipping.
COGS: landed cost of goods including manufacturing, inbound shipping, duties, and inspection. Do not include storage, which allocates to fulfillment.
Shipping and fulfillment: outbound shipping actual cost including DIM weight surcharges, warehouse labor per order (allocated), packaging materials per order, pack station overhead.
Attributed ad spend: total ad spend divided by attributable orders. Use blended MER (Marketing Efficiency Ratio) if attribution is unclear rather than trusting channel ROAS.
Return costs: reverse shipping + restocking labor + damaged inventory write-off + refund processing. Include compound cost of return communication and support handling.
Platform fees: marketplace referral fees (Amazon 8-45 percent by category), Shopify fees, subscription platform fees, integration platform fees.
Payment processing: 2-3 percent plus per-transaction fees (varies by country and payment method) totaling 3-5 percent of revenue.
Damage and reshipment: actual damage cases plus reshipment cost plus support handling. Use full-cost model (₹1,500-3,000 per case).
Fraud losses: empty-box fraud, wardrobing, chargeback losses, fake NDR cost, undefended wrong-item claims.
Support cost attribution: total support cost divided by orders. Include seasonal surge premium during peak.
Chargeback losses: chargeback amount plus fees plus reserve impact from ratio damage.
Calculation cadence: weekly at overall level, monthly at SKU and channel level, quarterly for full cohort analysis.
Which Margin Leaks Compound the Most?
Understanding compounding leak dynamics tells you where infrastructure investment produces the highest multiplier effect.
High-compounding leak categories:
Dispatch evidence infrastructure (single investment, multiple leak plugs):
- Plugs Category 2 (order accuracy dispute defense)
- Plugs Category 3 (empty-box fraud, fake NDR, wrong-item fraud)
- Plugs Category 4 (support acceleration, chargeback defense)
- Enables 3 categories of savings from one deployment
Trust signal infrastructure (compounds with acquisition and retention):
- Plugs Category 1 (improves conversion rate reducing effective CAC)
- Plugs Category 5 (drives repeat purchase from first-purchase trust)
- Reduces Category 3 (returns from set expectations)
Post-purchase communication (compounds across categories):
- Plugs Category 4 (WISMO reduction lowers support cost)
- Plugs Category 5 (drives repeat purchase in 60-day window)
- Reduces Category 3 (fewer dispute events through better information)
Customer risk scoring (compounds across loss prevention):
- Plugs Category 3 (fake COD, RTO, wardrobing all improve)
- Plugs Category 4 (fraudulent chargebacks decline)
Low-compounding leak categories (invest last):
- Warehouse floor layout (helps only Category 2 accuracy)
- Individual SKU packaging redesign (helps only Category 2 damage)
- Single-channel notification (helps only Category 4 WISMO)
Investment prioritization principle: deploy high-compounding infrastructure first. A single investment that plugs 3-6 categories delivers 3-5x the ROI of the same spend on single-category infrastructure. Dispatch evidence sits at the top of this list for most operations, which is why brands running TrackVid consistently show the largest margin recovery in the shortest window.
Where TrackVid Fits in Your Margin Recovery Stack
Steps 1-2 (measurement and prioritization) need standard analytics infrastructure. Steps 3-5 (infrastructure deployment across all 3 clusters) is where TrackVid becomes decisive as the highest-compounding single infrastructure investment.
TrackVid is a video proof and claim management platform used by 1,100+ ecommerce sellers on Shopify, WooCommerce, Amazon, Flipkart, Myntra, AJIO, Nykaa, Meesho, and Snapdeal. Officially authorized by Snapdeal. Brands using TrackVid include Rare Rabbit, Wrogn, The Indian Garage Co, The Bear House, HRX, Nike, Jordan, Tommy Hilfiger, and Snitch.
For plugging where ecommerce profit margins leak specifically, TrackVid delivers:
- Order ID-linked dispatch video on every packing station without workflow changes. Single infrastructure investment that plugs 6 distinct leak categories: damage disputes, empty-box fraud, wrong-item claims, chargeback defense, support acceleration, and marketplace claim automation.
- 90 percent plus dispute win rate on wrong-item and empty-box claims versus 30-40 percent for manual defense without evidence. Directly recovers 1-3 percent of revenue from Category 3 losses.
- Weight reconciliation between dispatch and return receipt catches empty-box fraud that visual evidence alone could miss. Eliminates a category of loss most brands never even measure.
- Support ticket acceleration through instant dispatch evidence retrieval. First-contact resolution rises from 55-65 percent to 85-90 percent, reducing Category 4 support cost 40-60 percent.
- Auto-files claims on marketplaces (Myntra, AJIO, Nykaa, Meesho, Snapdeal) for the dispute defense that would otherwise consume 15-20 minutes per manual claim. Critical during peak volume surges when hundreds of disputes arrive daily.
- Return reconciliation module cross-references NDR and return events against dispatch evidence to prevent fake NDR cost and empty-box fraud simultaneously.
- WhatsApp packing video share for high-AOV orders. First-purchase trust artifact that seeds retention (Category 5) and reduces buyer's remorse (Category 4) simultaneously.
For related workflows across the complete margin recovery framework, see our full Phase 2 playbook stack:
Loss Prevention Cluster: How to Reduce Ecommerce Return Rate | How to Reduce RTO in Ecommerce | Fake COD Order Detection | Customer Risk Scoring | NDR Management Ecommerce
Growth Cluster: Post-Purchase Experience | How to Increase Repeat Purchase Rate | How to Build Customer Trust in an Online Store | How to Get More Sales From Your Online Store | How to Get More Product Reviews and Protect Ratings
Operations Cluster: Ecommerce Packaging Best Practices | How to Improve Order Accuracy | How to Reduce WISMO Queries | Sale Season Operations Playbook at trackvid.in.
WROGN's pilot data shows the pattern clearly. Across 95,836 tracked orders and 868 claims filed, systematic dispatch evidence combined with post-purchase communication moved claim approval from 42.3 percent (June) to 60.3 percent (July) within one month, while plugging multiple margin leak categories simultaneously across all cohorts using the complete infrastructure stack.
In a 30-minute call, our team walks through your specific contribution margin leaks across all 5 categories, quantifies the total recovery opportunity, and shows you exactly how dispatch evidence infrastructure plugs 6 categories simultaneously. No commitment, no obligation.
5-Question Contribution Margin Audit
1. Do you measure true contribution margin or only gross margin? If only gross margin, your reported profitability is likely overstated by 40-80 percent, and you cannot prioritize leak plugs correctly.
2. Which of the 5 leak categories consumes the largest percentage of your revenue? If you cannot answer with specific numbers, category-level tracking is your Step 1 priority before any infrastructure investment.
3. Do you have infrastructure that plugs multiple leak categories with one investment (dispatch evidence, trust signals, post-purchase communication) or single-category investments? Multi-category infrastructure delivers 3-5x higher ROI on the same spend.
4. What is your dispute win rate on wrong-item and empty-box claims? If below 60 percent, you are absorbing fraudulent claims as losses that dispatch evidence infrastructure would defend at 85-90 percent win rate.
5. What is your true contribution margin recovery opportunity if you deployed structural infrastructure across all 5 leak categories? Brands running the complete framework consistently recover 8-15 percentage points within 90 days.
See exactly where your contribution margin leaks are concentrated and how dispatch evidence plugs 6 categories simultaneously. 30 minutes. No commitment.
Frequently Asked Questions
Where do ecommerce profit margins leak?
Ecommerce margins leak across 5 categories: acquisition (ad spend 20-35 percent with CAC up 60 percent over 5 years), operations (packaging waste, damage, DIM weight surcharges totaling 4-9 percent), loss prevention (RTO, fake COD, NDR, empty-box fraud totaling 5-12 percent), post-purchase (WISMO cost, chargebacks totaling 2-6 percent), and retention opportunity cost (missing RPR infrastructure costing 5-15 percent). Structural infrastructure recovers 8-15 percentage points within 90 days.
What is a good ecommerce contribution margin?
Category-specific benchmarks: beauty 25-35 percent, fashion 15-25 percent, consumables 30-45 percent, electronics 15-22 percent, jewellery 25-40 percent. By business model: D2C 8-15 percent net margin, marketplace-first 3-8 percent, dropshipping 15-25 percent healthy. Median D2C contribution margin fell from 35 percent (2021) to 22 percent (2025). Best-in-class brands maintain 30-40 percent through structural infrastructure.
What is the difference between gross margin and contribution margin?
Gross margin (Revenue - COGS) measures only the gap between production cost and selling price. Contribution margin (Revenue minus COGS minus Shipping minus Ad Spend minus Returns minus Fees minus Payment Processing minus Damage minus Fraud minus Support) measures actual dollars remaining after all variable costs. Gap between gross and contribution margin typically runs 40-60 percentage points. Only contribution margin tells you if the business is worth running.
How do you calculate true ecommerce profit margin?
True Contribution Margin = Revenue - COGS - Shipping/Fulfillment - Attributed Ad Spend - Return Costs - Platform Fees - Payment Processing - Damage/Reshipment - Fraud Losses - Support Cost Attribution - Chargeback Losses. Track weekly at overall level, monthly at SKU and channel level. Common measurement mistakes: using gross margin as proxy, missing damage and empty-box fraud, treating chargebacks as one-off events, not allocating support cost.
What is the biggest cost in ecommerce?
Ad spend consumes 20-35 percent of revenue and is the largest single cost category for most D2C brands. COGS follows at 30-40 percent. Shipping and fulfillment: 15-20 percent. Returns cost: 3-8 percent. Support cost overhead: 1-3 percent. Platform fees: 3-8 percent for D2C, 8-45 percent for marketplace-first. Payment processing: 3-5 percent. CAC has surged 60 percent over 5 years and continues rising.
How much does return processing cost ecommerce brands?
Return processing costs 3-8 percent of revenue at typical operations. Direct cost per return: ₹200-500 (reverse shipping, restocking labor, refund processing). Full cost including compound effects (customer trust damage, review impact, LTV reduction): ₹1,000-2,500 per return. Fashion category has 20-30 percent return rate. Structural return rate reduction through better product page trust signals recovers 3-5 percent of revenue.
How much do chargebacks cost ecommerce brands?
Chargebacks cost 0.3-1.5 percent of revenue at typical operations, with direct losses plus penalty fees plus reserve impact from ratio damage. Chargeback ratios above 1 percent trigger merchant account penalties. Chargebacks arrive 60-90 days after original transaction requiring persistent response infrastructure. Dispatch evidence defends chargebacks at 84 percent win rate versus 27 percent without evidence.
Which margin leaks are easiest to fix?
Easiest fixes (30-day payback): WISMO reduction through proactive notifications, dispatch evidence deployment for support acceleration, cart abandonment recovery workflows. Next tier (60-day payback): order accuracy through barcode scanning, fraud detection through customer risk scoring, review generation infrastructure. Structural retention infrastructure delivers largest recovery (90+ day payback) but requires longest investment window.
Does dispatch evidence improve ecommerce margins?
Yes. Dispatch evidence plugs 6 distinct margin leak categories with one infrastructure investment: damage disputes (Category 2), empty-box fraud (Category 3), wrong-item claims (Category 3), chargeback defense (Category 4), support acceleration (Category 4), and marketplace claim automation. Combined effect: 3-5 percentage points of contribution margin recovery on typical operations within 90 days from single infrastructure deployment.
How to reduce ecommerce operating costs?
Reduce ecommerce operating costs through structural infrastructure across 5 leak categories: measure true contribution margin (not gross margin), identify top 3-5 leak concentrations, deploy high-compounding infrastructure that plugs multiple categories simultaneously (dispatch evidence, trust signals, post-purchase communication), prioritize infrastructure with 30-60 day payback, track leak reduction weekly against margin improvement. Recovers 8-15 percentage points within 90 days.
Sources: Luca Ecommerce Profit Margins Benchmark Report 2026, Fairview D2C Metrics 2026, EcomCalcTools Ecommerce Profit Margin Benchmarks 2026, SureBright Increasing Ecommerce Profit Margins 2026, SimpliConvert Ecommerce Margins Report 2026, Endless Commerce Contribution Margin Framework 2026, Ecom CFO 2026 State of DTC Profitability Report, TrackVid platform data across 1,100+ sellers, WROGN pilot data (94,904 videos, 95,836 tracked orders, 868 claims filed)
TrackVid is a video proof and claim management platform used by 1,100+ ecommerce sellers on Shopify, Amazon, eBay, Flipkart, Myntra, AJIO, Nykaa, Meesho, Bol.com, Zalando, MyDeal, PayPal, and Snapdeal. Officially authorized by Snapdeal. Brands trusting TrackVid include Rare Rabbit, Wrogn, The Indian Garage Co, The Bear House, HRX, Nike, Jordan, Tommy Hilfiger, and Snitch. Learn more at trackvid.in.

Get the Marketplace Claim Recovery Checklist
A 12-point checklist used by 1,100+ sellers to recover 85-90% of marketplace claim losses. Free, instant access.
- Marketplace-specific evidence formats (AJIO, Flipkart, Amazon, Myntra)
- Claim window deadlines for every major platform
- The 6-step process that pushes approval from 85-90%
- Common rejection reasons and how to avoid them
No spam. Unsubscribe anytime. Used by sellers at Rare Rabbit, HRX, Da Milano + 1,100 more.
Stop Losing Money to Fake Returns
Join 1,100+ sellers who recover lakhs every month with TrackVid